Testing a newly installed optical-fiber cable plant is crucial to ensuring the overall integrity and long-term performance of a network.
Todd Jennings, Siecor Corp.
Simple, reliable and field-proven test procedures have long been established for certifying that an optical-fiber cabling system is correctly installed. Proper testing maximizes system longevity, minimizes downtime and maintenance, and facilitates upgrades and reconfigurations. Documenting test results quantifies system quality, identifies potential cable and component faults, and establishes accountability when several vendors are involved.
The information provided here is in accordance with Annex H of American National Standards Institute/Telecommunications Industry Association/Electronic Industries Association-568A, optical-fiber link performance testing. Because the annex addresses only the end-to-end attenuation test, we have combined this with additional information on other test methods and common field test practice.
End-to-end attenuation and optical time-domain reflectometer tests quantitatively measure the installed performance of a cable system and its components. In preparing for field tests, the following guidelines are important to ensure accurate test results:
Make sure the test jumpers (for end-to-end attenuation testing) or the test fiber box (for OTDR testing) are of the same fiber core size and connector type as the cable system--for example, 62.5-micron core test jumpers should be used for testing a 62.5-micron multimode cable.
Ascertain that optical sources are stabilized and have center wavelengths within ?20 nanometers of the 850/1300-nm multimode and 1310/1550-nm singlemode nominal wavelengths. In accordance with TIA/EIA-526-14A, multimode light-emitting diode sources should have spectral widths from 30 to 60 nm at 850 nm and 100 to 140 nm at 1300 nm.
Ensure the power meter is calibrated at each of the nominal test wavelengths and traceable to the National Institute of Standards and Technology calibration standard.
Set the power meter end and the light source to the same wavelength.
Clean all system connectors, adapters and jumpers prior to measurement.
End-to-end attenuation test
Attenuation, defined as optical power loss measured in decibels, is the main parameter field-tested in optical-fiber systems. Cables, connectors, splices and patch cords contribute to a system`s overall attenuation. Additional loss may also be induced by tight bends or excessive forces placed on the cable during transportation and installation.
The single most important test of an installed link, then, is end-to-end attenuation. This is a measure of the optical power loss between cable termination points. Acceptable loss values are dependent upon the system length, wavelength and number and type of connectors and splices.
The end-to-end loss should always be less than the link-loss budget calculated in the system design (see "Determining optical fiber link loss," June 1995, page 52). The best way to verify that the cable meets the loss limit is to measure each segment from patch panel to patch panel. Because of the stress and bending that cables can be subjected to during installation, you should measure the attenuation of each connectorized link after installation.
Attenuation is measured by comparing the difference in two optical power levels--first measuring how much light is put into the cable at the near end, and then measuring how much light exits the far end after the cable system is inserted in between. These absolute optical power levels are measured in decibels relative to milliwatts. By definition, 0 dBm is equivalent to one milliwatt of power--hence the "m" in dBm. Note that virtually all of the optical power levels in premises applications will be negative dBm values, indicating levels less than one milliwatt. A typical light-emitting diode has an output power of approximately -20 dBm. Loss values in dB are determined by subtracting two absolute power levels in dBm: Loss (dB) = P2 (dBm) - P1 (dBm).
End-to-end attenuation testing of installed cable systems is performed using a three-step procedure known as the insertion-loss method (see "End-to-end attenuation test," page 39). A stabilized light source and optical power meter are used to measure the attenuation of each terminated fiber. Best results are achieved with factory-terminated test jumpers. The test is conducted in accordance with TIA/EIA specifications--multimode fiber is tested using TIA/EIA-526-14A, Method B; singlemode fiber utilizes TIA/EIA-526-7, Method A.1.
Application guidelines
This insertion-loss procedure includes the representative connector loss at the connecting hardware associated with the mating of patch cords. It does not include the connection at the transmission equipment interface, which is normally accounted for in the acceptable loss budgets of the transmission electronics.
For backbone cabling, we recommend end-to-end attenuation tests at both specified wavelengths for every connectorized fiber in backbone segments. Multimode fibers should be tested in one direction at 850 and 1300 nm, and singlemode fibers should be tested in one direction at 1310 and 1550 nm to account for attenuation differences due to wavelength. The attenuation of a system at one wavelength is not necessarily related to that of the other. Some end users require bidirectional loss testing to meet transmission equipment certification or site standards.
Acceptable link attenuation is dependent on the backbone length and the number of splices. Keep in mind that attenuation figures are based on optical cable loss, two connector pairs and no splices per TIA/EIA-568A. If the link contains splices or additional connector pairs, add 0.3 dB per splice point and 0.75 dB per connector pair.
For horizontal fiber cabling, the short lengths of the multimode segments--typically less than 300 feet--result in connector-dominated loss that is relatively independent of wavelength. End-to-end attenuation testing is typically required in only one direction at a single wavelength, commonly 850 nm, with loss less than or equal to 2.0 dB for each fiber link.
Test equipment for attenuation testing
The primary tools used to perform end-to-end attenuation tests are the optical power meter and optical light source. Optical power meters are the most common fiber-optic tool and measure optical power levels in dBm and losses in dB. Although some models measure either multimode or singlemode fibers, the most popular devices can measure both fiber types at the 850-, 1300-, 1310- and 1550-nm wavelengths for which fiber is specified.
Optical power meters capable of storing multiple references are valuable for dual-wavelength, end-to-end attenuation testing; loss values can be read in decibels on the display--without calculations. Interchangeable connector adapters allow no-tools adaptation to a variety of connector types. Other popular features include rugged, handheld packaging for field use; backlit graphic display for use in dark wiring closets; and radio-frequency shielding to prevent error-causing interference from computers and other electronics.
Optical light sources are important companions to optical power meters for end-to-end attenuation testing. They are designed to launch a stabilized light of steady output power and known wavelength into the fiber. Light-emitting diodes at 850 and 1300 nm are used for multimode testing, while 1310- and 1550-nm lasers are used for testing singlemode fiber systems.
When performing bidirectional attenuation testing, a pair of optical testers that combine an optical meter and optical source in the same unit are commonly used to save testing and travel time. A pair of optical testers can also be used on duplex connector systems, such as those using the 568SC, to test both fibers simultaneously and ensure the proper polarity.
A single unit can be used to inspect cable on the reel, test cable assemblies and measure looped fiber attenuation.
OTDR testing
End-to-end attenuation testing measures the total amount of loss between two endpoints. To find out what causes this loss and where it occurs in the cable system, an optical time-domain reflectometer is needed. An OTDR can locate fiber events and measure the losses attributable to cable, connectors, splices and other components. The graphical display of loss over a cable`s entire length provides the most revealing analysis and documentation available on a cable link; this is commonly referred to as the link`s signature trace.
Because of the OTDR`s ability to provide detailed analysis of individual installed components with access to only one end of the fiber, it is a versatile installation and troubleshooting tool that can be used in a variety of scenarios:
Cable acceptance -- The OTDR evaluates the integrity, overall length and fiber attenuation in decibels per kilometer for cables before and after installation. This is useful for checking a cable against specification, uncovering point defects that result from handling during transportation or installation and measuring unterminated fibers.
Signature trace documentation -- The device provides useful documentation for cable system acceptance, network planning and maintenance as the "as-built" fiber blueprint.
Connector and splice loss -- The instrument measures and documents field-installed connectors and mid-span mechanical or fusion splices. This allows the installer to determine whether a splice or connector is acceptable or needs to be reworked.
Troubleshooting --The OTDR provides a benchmark of initial system performance for comparisons over time and a tool for identifying and locating cable problems or breaks. Fiber discontinuities and localized losses are clearly visible when compared to original signature traces.
A single OTDR signature trace of each fiber provides a clear picture of the entire cable. Although attenuation testing confirms the end-to-end loss, OTDR analysis can document the integrity of the cable system, locate and measure each event or component, and uncover faults throughout the cable.
Prior to cutting fiber on a reel into sections and installing the various cable segments, for example, an OTDR can provide proof of an optical fiber cable`s initial quality and integrity. Using a Camsplice or bare-fiber adapter to access one cable end, you can use an OTDR to verify the length and attenuation of each fiber. The device can also detect point faults or discontinuities that develop during shipping and handling. This inspection can provide important protection against liability when several parties are involved in an installation.
For backbone cable, we recommend that after installation and termination you use an OTDR to test each fiber at one wavelength (850 or 1300 nm for multimode, 1310 or 1550 nm for singlemode) on all backbone segments that are longer than 300 feet long. For simple point-to-point connectorized links, we recommend OTDR inspection to verify installed cable integrity and length. For more complex links that include a splice or mid-span connection point, we suggest documenting the signature trace of each fiber in either computer-file or printed form. Some end users require dual-wavelength (850/1300 nm for multimode, 1310/1550 nm for singlemode) or bidirectional testing to meet transmission equipment certification or site standards.
In addition, for backbone segments we recommend OTDR measurement of each field-installed connector and each mechanical or fusion splice at one wavelength to ensure they meet acceptable loss values. Unless specified otherwise, acceptable losses are less than or equal to 0.75 dB per mated connection and less than or equal to 0.3 dB per splice.
To measure near-end connector loss, a test fiber box of sufficient length is used to connect the OTDR and the patch panel. The fiber length in such a box is typically greater than or equal to 90 meters for multimode, or greater than or equal to 200 meters for singlemode. Use of a test fiber box also allows simultaneous OTDR testing of a link`s signature trace and near-end connector loss. These test results can be documented together on OTDRs that provide event tables.
Based on the short length of and easy access to horizontal fiber segments, OTDR testing is not required for certification. When the end-to-end attenuation of a horizontal link exceeds the 2.0 dB loss limit, an OTDR can be used to inspect and troubleshoot links of 100 feet or more to isolate a faulty connector or cable.
Bandwidth and dispersion are measures of the information-carrying capacity of multimode and singlemode fibers, respectively. The cable can be specified for various grades of bandwidth or dispersion performance. Actual system bandwidth or dispersion is a function of the fiber quality, length and transmitter characteristics. Because this capacity is not adversely affected by installation, field testing of these parameters is not required. It is common practice to specify cable bandwidth and dispersion performance to meet the requirements of TIA/EIA-568A, ensuring compatibility with transmission electronics without field testing. The manufacturer`s bandwidth and dispersion performance should be documented on a specification sheet and saved for future reconfigurations and upgrades.
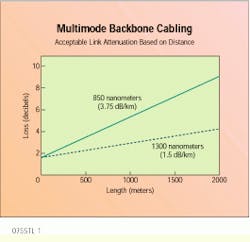
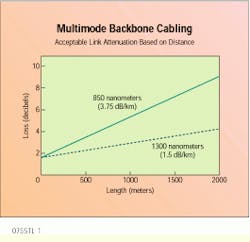
Shown is acceptable link attenuation based on distance for 62.5/125-micron backbone fiber cable. The two lines represent the attenuation changes between 850- and 1300-nm wavelengths.
End-to-end Attenuation Test
Step 1: Reference
Connect a short test jumper (containing the same fiber type as the system fiber) between the optical source and the optical power meter. Record the reading as the reference power in decibels relative to milliwatts. This power level is the output power of the light source coupled into the jumper.
Never disconnect or adjust the jumper connection at the optical source after recording the reference value. This can change the value and cause final test results to be inaccurate.
Although the output connector of the optical source can be different than the system connector type, the optical meter`s connector input must match the system. It is important, therefore, that the optical meter have interchangeable connector adapters.
Step 2: Check
Disconnect test jumper #1 at the power meter and insert a second test jumper (test jumper #2), using an adapter, between the jumper used in Step 1 and the optical power meter. Verify that the two test jumpers are not faulty by ensuring the power level is within the appropriate connector loss--typically 0.5 dB--of the reference reading. If this criterion is met, continue to Step 3. Otherwise, clean all connectors except the source connection point and repeat Step 2. If the loss is still greater than 0.5 dB, replace test jumper #2 and repeat Step 2.
Note that 0.5 dB is typically used for factory-terminated SC- or ST-compatible connector test jumpers. The appropriate value is the guaranteed maximum pair loss for the specific type of connector used.
Step 3: Test
Leave the two test jumpers attached to the optical source and optical power meter. Disconnect the two jumpers at the adapter. Attach the optical source/test jumper #1 to one end of the system fiber to be tested and the power meter/test jumper #2 to the other end of the same fiber. Record the power level in dBm and calculate the loss in dB. Repeat this step for each fiber to be tested.
You should be aware that some power meters store reference power and automatically display loss results directly in dB. This saves time, eliminates calculation errors and reduces record-keeping in the field. In this case, store the reference value from Step 1 in the meter and read the loss results in dB from Steps 2 and 3.
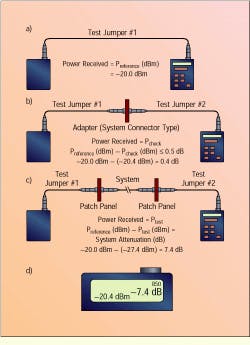
Here is the reference setup (a) for an end-to-end attenuation test using an optical power meter and light source. In the checking step (b), an adapter is used to connect two test jumpers. In the testing step (c), the actual fiber link to be tested is substituted for the adapter. This power meter display (d) shows loss directly in dB versus dBm.
Todd Jennings is product manager for optical test equipment at Siecor Corp., Hickory, NC.


