Software helps map out a data center strategy
By James Sherrin
To properly manage the physical layer in mission-critical data centers, you need to go far beyond the traditional spreadsheet.
Whether you are planning a hike in the woods, or your route for a cross-country race or any other journey, having an accurate, intelligible map is critical to success. This visual representation of the world (or a small slice of it) makes it easier to determine the best path between two points, and to plan for various eventualities that may occur along the way.
With the complexity inherent in today’s data centers, it would seem to make sense to use a similar visual representation of the myriad devices and connections so you can gain a better understanding of both the big picture and the specifics. Yet that is not the case. Instead, in many data centers, this information is tracked on basic spreadsheets, which make it far more difficult to see the hierarchical relationship among devices or understand the connectivity between them.
Groping in the dark
The problem with the traditional spreadsheet approach in the data center is that anything difficult to comprehend is also difficult to manage and, therefore, prone to error.
Imagine trying to win a cross-country race by referencing a series of alphanumeric coordinates listed in a spreadsheet and created by someone you have never met. It could be done, but it would be far more difficult than looking in an atlas where cities, highways, and landmarks are shown pictorially in relationship to each other. And if the spreadsheet has not been updated, or data is entered incorrectly, you may discover that the road you thought you needed to take has been closed, leaving you at a dead end.
Those charged with managing data centers face exactly this challenge. Spreadsheets remain pervasive, a holdover from the 1980s when documenting network devices and connections involved a few hundred entries at most. Yet spreadsheets can no longer provide the level of detail and insight required in an atmosphere where “five nines” percentage of uptime is now the minimum requirement rather than the goal.

Data center managers can replace those spreadsheets with the new generation of infrastructure-management software designed to handle the data center’s level of complexity. This software helps simplify data management, improves the accuracy of documentation, provides more intuitive views into hierarchy and connectivity between devices, creates audit trails that assure the ability to track backwards if there is a problem, and performs a myriad of other functions that basic spreadsheets cannot. It also assists with implementation of best practices for a variety of compliance issues, including the IT Infrastructure Library (ITIL).
A more thorough examination of the two shows the advantages of moving away from spreadsheets and into infrastructure-management software.
The cost of “free”
Among the reasons spreadsheets first came into use in infrastructure management were their ready availability and the perception that they were free. Both of these factors were the result of the nearly ubiquitous inclusion of stand-alone spreadsheet applications or office suites on personal computers manufactured beginning in the 1980s. Spreadsheets provided a convenient means of logging the limited amount of data required at the time.
Even as computer networks grew in size and scope in the 1990s, the spreadsheet remained the management tool of choice, despite its growing inadequacies. Where once it was considered a time-saver over paper record-keeping, the spreadsheet now became more of a burden. As often happens, accurate documentation began falling by the wayside due to other, more urgent IT needs. Once the documentation fell behind, the value of spreadsheets lessened greatly.
The introduction of data centers to accommodate the Internet/e-commerce-centric world of the late 1990s and beyond only exacerbated the problem. The limitations of the “free” spreadsheet tool created a cost burden in terms of IT man-hours. While spreadsheets might provide a starting point or give some clues as to the connectivity in place, in practice, IT personnel charged with fixing problems or even simply moving a device from one rack to another often have to perform manual, physical circuit traces to get the data they need.
Infrastructure-management software can solve those problems. It helps create complex IDs, automatically referencing a parent’s name to create the child name. It also uses Internet Protocol (IP) discovery to automatically identify, create, locate, and connect end devices to their appropriate outlet in the database. This operation requires minimal user intervention, which not only saves time but also removes the risk of human error during data entry. Often, the audit costs saved through this feature justify the cost of the software. Additional audit and data-input savings can be achieved if the software includes “intelligent patching” features.
It is rarely practical or possible to document the entire infrastructure between a switch port to the remote connection using a single spreadsheet. Multiple sheets are generally needed to document the various intermediary points between the ends of the network connection, requiring multiple data entries. For a data center manager working under a tight time constraint to correct a problem, bring an asset back online, or even get a new server installed without impacting other servers, moving between multiple spreadsheets is highly inefficient.
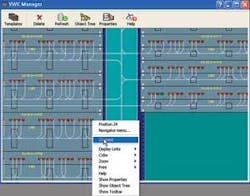
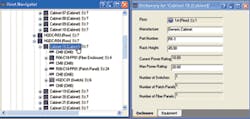
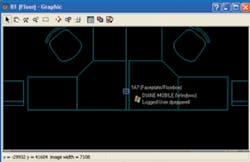
Infrastructure-management software searches for any component in a circuit using a Windows Explorer-type parent-child data structure. With a single click, users can display a circuit trace of the entire connection with all intermediary components, right down to the physical location. This information can also be displayed against a CAD drawing of the building or data center, providing extremely accurate information in an easy-to-read, map-like format.
Logical information, such as IP addresses, subnets, and host names are also impractical to include in spreadsheets, as they can quickly become inaccurate. Using infrastructure-management software with IP discovery, the correlation between end devices and their logical network information is 100% accurate because the data is maintained automatically.
Assuring data integrity
With data centers being mission-critical, verification is needed at every stage during the change cycle, unless the data can be assured of being entirely accurate. Although spreadsheets allow implementation of strict change-control processes, they are susceptible to human error during data entry, and are prone to updating delays and complete bypass of the change-control process. Errors can be introduced easily if the person entering the data feels rushed for time, becomes distracted, or simply has little interest in the mundaneness of documentation.
Infrastructure-management software entirely avoids errors from user entry and updating delays. The work-order system automatically updates the database as the technician’s assigned tasks are reported and completed. And the IP-discovery function provides a further safeguard that the data exists as it appears in the software.
Spreadsheets contain minimal reporting functions, and users are limited to viewing the data and the way it was created. Because this involves several workbooks, viewing data is a slow process that involves cutting and pasting to produce reports that can be analyzed. Infrastructure-management software, however, seamlessly includes report output and report generators, which produce user-defined output, including filters on any aspect of the infrastructure.
Following audit trails
Spreadsheets do not allow tracking of changes unless the user creates a separate log every time a change is made or keeps multiple versions. In a data-center environment, keeping multiple logs or versions is simply impractical. The organization literally would have thousands of spreadsheets, which would effectively obscure any reasonable audit trail.
Because infrastructure-management software uses a database structure, tracking back through changes is simple. The software lets IT personnel run reports that detail the entire history of a device or circuit. Log entries are time-stamped and cross-referenced with the actual changed item and vice versa, making it easy to look up any item’s log history.
Users can also perform historical analysis on the log to report any captured information, such as the frequency of changes, their cost, and department code. As a result, the organization achieves a 360-degree view of the infrastructure and every device within it.
Because they are an offline technology, spreadsheets are typically unable to detect logical devices or check for violations in network policy. For data centers that deal with security-sensitive information, such as customer credit cards and social security numbers, this lack of control is simply unacceptable.
The network-discovery function of infrastructure-management software can determine when violations of policy occur from the Simple Network Management Protocol (SNMP) “public” string response. It should allow for reports on device redundancy, so corrections can be made before a fatal or near-fatal event occurs.
Avoiding dead ends
While they were useful “back in the day,” spreadsheets are no longer capable of providing the depth of information with the proper level of accuracy required in today’s high-pressure, high-availability data-center environment. As time goes on, they are far more likely to lead to dead ends rather than to the information superhighway.
Infrastructure-management software, with its auto-discovery capabilities and database structure, lets data center managers gain an accurate view of both the hierarchy and connectivity of every device on every circuit that is part of the infrastructure. With this information in hand, a better strategy for today and the future can be mapped out.JAMES SHERRIN is product manager for physical layer management and infrastructure management products with iTRACS (www.itracs.com)