A practical approach to implementing power delivery over structured cabling
By Sterling Vaden, Surtec Industries
This article will provide a “rough guide” for an IT administrator who is implementing a Power over Ethernet (PoE), PoE+ and/or four-pair PoE++ power over an existing cabling plant, and some implied guidance for new installations. The primary focus will be on “rule-of-thumb” considerations for how to distribute power over existing cabling plants, simple measurements and calculations to determine whether temperatures of cabling may exceed their ratings, and considerations for connector performance and overall reach reduction.
PoE is a general term that applies to standardized power delivery over data cabling using IEEE 802.3 standards and also to proprietary schemes that are sold by a number of manufacturers. Regardless of the type of powering method used, there are fundamental physical factors that apply, and when devices are powered over the communications cables, there is loss in the cables themselves, which raises the temperature of the cables. For IEEE 802.3 PoE and PoE+ powering over two pairs, this heating effect is low enough that it is not a concern to the IT administrator, except in certain corner cases that are outside of standard cabling plant recommendations. The guides in this article will focus on deployment of high power PoE++ where all four pairs are used and higher currents are employed. This standard is still under development by the IEEE 802.3bt DTE Power via MDI over 4-Pair Task Force, so four pair powering is primarily for future installation.
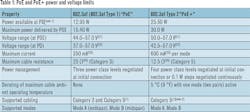
The currently standardized PoE and PoE+ IEEE 802.3af and IEEE 802.3at specifications (which have both been incorporated into the main 802.3 standard) are shown in Table 1. Both specs use two pairs of the four pairs in a cable to provide power. Note that the maximum power provided by the PSE (power sourcing equipment) is 15.4W for PoE and 30W for PoE+. This level of power will not heat the cable significantly. Notice that for PoE+ the maximum operating temperature is de-rated by 5 degrees C. This is the maximum amount the cable temperature is expected to increase. The maximum ambient temperature for most installations is 45 degrees C. Because the maximum operating temperature of standard communications cables is 60 degrees C, there are no temperature concerns for cabling providing PoE or PoE+ power levels.
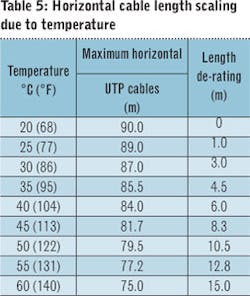
What about cabling reach? If we assume a maximum of 5-degree temperature rise, consulting table G.2 of TIA-568-C.2 (partially included in this article’s Table 5) would indicate a 1-meter decrease in maximum length capability due to increased insertion loss. If your application is right on the ragged edge of length support, say 150 meters or so for 1000Base-T (beyond the 100-meter installation guidelines) you might run into a problem. A 1-meter problem.
First rule: For PoE and PoE+ cable temperature and reach reduction is not a significant concern.
Four-pair powering
Now for the more interesting stuff. For four-pair power with at least 60W supplied, and up to 100W per port, we are going to have to take into consideration the temperature rise in bundled cabling when a high percentage of cables are powered. Guidelines for cabling are given in TIA TSB-184-A, which is nearing publication. In that document there are tables of temperature rise for different bundle sizes and various cable types. There are tables of maximum bundle sizes for a given temperature rise, and maximum ampacities for given bundle sizes. The ampacity tables are similar to tables in the 2017 revision of the National Electrical Code (NEC). The NEC tables use different assumptions about ambient temperature than the TIA tables. The NEC and TIA tables were developed from different sets of data and were also developed completely independently of each other, so they don’t exactly coincide. The NEC tables, unlike the TIA tables, are requirements that electrical inspectors will use to determine the adequacy of communications cabling to support powering.
Some conventions that we should understand: Smaller wire gauge (26 AWG) heats up more than larger wire gauge (23 AWG). Easy. For most applications, UTP category rated cabling is installed. Patch cords can have wire gauge as small as 26 AWG stranded. Category 5e cables are 24 AWG; Category 6 and Category 6A cables are 23 AWG.
Category 7A, Category 8, and other shielded cables are peripheral to the scope of this discussion due to their relatively small market share in the U.S. In Europe, of course, you will have a much greater installed base of shielded cable types. The good news is that they will have a lower temperature rise than the equivalent UTP cable types. Shielded cables dissipate heat better than UTP cables.
Ambient temperature - Standard ambient temperature is 20 degrees C, or 68 degrees F. Nice and comfortable for man and machine. TIA considers the maximum ambient temperature to be 45 degrees C, or 113 degrees F, which is pretty darn hot. The National Fire Protection Association (NFPA), creator of the NEC, considers the maximum ambient temperature to be 30 degrees C, or 86 degrees F. This is not that hot. You might find temperatures within a ceiling space that would exceed that, so for the most part we will use the TIA maximum ambient temperature.
Maximum cable temperature - For standard cable types, it is 60 degrees C, or 140 degrees F. This is the cable maximum temperature rating, rated for mechanical performance, not data transmission. We will see that data transmission reach must be de-rated at high temperatures. There are cables available with higher temperature ratings, such as 75 degrees C, or even 105 degrees C, so that it is a viable option if one is installing cabling just for high temperatures. Of course, those cable types may be more expensive, so it may not justify the expense over the whole cabling plant. Not only must these cables still be de-rated for reach at higher temperatures, but there will be greater loss, even if the high temperatures are only due to increased current levels.
As a general rule of thumb, when using four-pair powering, 600mA per pair powering current will require at least 60W of power from the PSE, yielding somewhat less power at the PD depending on the length and type of cabling in between. 1000mA per pair will require at least 100W from the PSE. This is without taking into consideration the efficiency of the PSE itself, which will vary, depending on many factors. The power input to the PSE from the electrical supply will be at least 10 percent higher than the power available at the PSE interface.
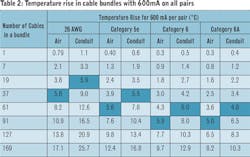
Let’s look at a partial table of temperature rise for cable bundles with 600mA per pair current, all pairs powered in a bundle, Table 2.
The first simple thing we can determine from this table, is that for one cable, in the air or conduit, the temperature rise will be less than 1 degree C. We don’t expect 26 AWG patch and equipment cords to be installed in conduit. A 5-degree temperature rise is not reached until you get to about 61 Category 5e cables in air, or 37 in conduit, with all cables powered. That means you need roughly 4kW to power 61 PDs with less than 60W each, all from the same bundle. That is two-and-a-half 24-port power supplies. It’s do-able, but that is a lot of power required to get a 5-degree rise in the cabling. TIA recommends a maximum temperature rise of 15 degrees based upon the maximum ambient temperature of 45 degrees and the cable rating of 60 degrees. Table 2 shows that it is possible to achieve a 15-degree temperature rise only with a 169-cable bundle of Category 5e cables in conduit (11kw input) or with more than 127 cables of 26 AWG in air. One could easily substitute 24 AWG patch cables, which are the norm for Category 5e.
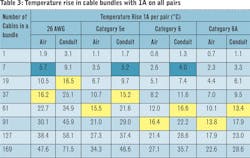
Table 3 is the same temperature rise table for 1A (1000mA) per pair currents, or 100W PSEs.
We can see that now there are considerably higher temperatures possible, especially for large bundles. Remember to add the ambient temperature to the figures in Table 3 to get the total temperature. Also note that for a single powered cable, the temperature rise is still less than 2 degrees, even for 26 AWG patch cords. Table 3 clearly shows that at an ambient temperature of 20 degrees C, for Category 5e cables in a fully powered bundle, you can achieve a 15-degree temperature rise with only a 61-cable bundle in air, or a 37-cable bundle in conduit. So at this point we need to be careful.
There is also an increase in copper resistance with an increase in temperature. The TIA length de-ratings for example, are based mostly on this increase in resistance. This means that the temperature rise of the cables will be higher supporting the same currents if the ambient temperatures are higher. Therefore the maximum ambient temperature anywhere the cable bundle goes must be factored into the temperature-rise calculation. For example, a current of 1A that creates a 15-degree rise at 20 C ambient may result in an 18-degree rise at 45 C ambient. It may be a small amount overall, but it can be significant.
The maximum bundle size allowable for a 15-degree temperature rise with ambient temperature of 45 degrees C is shown in Table 4. These are the maximum bundle sizes for fully powered bundles. Values are shown for 60W and 100W power.
I won’t get too deep into tables of temperature rise, ampacity, and bundle size. Ampacity tables, for example, are great help to power-supply designers, but are not very much help to someone installing IEEE-compliant PoE++ into a new or existing cabling plant because the current is already determined by the application.
A single cable powered (again) - For one cable, in air or conduit, the temperature rise for horizontal cables will be less than 2 degrees. Further, it also turns out that if you surround that cable with six or more cables that are not powered, or even 18 cables or more, the temperature rise will still be less than 2 degrees, even with 100W four-pair power. In fact, you can surround that one powered cable with insulation and it still will not overheat. To extend this principle, suppose you have seven powered cables in the middle of a larger bundle of non-powered cables. The maximum temperature will still be close to what is predicted for the seven-cable bundle. If the seven powered cables are distributed evenly within the larger unpowered cable bundle, the max temperature, of course, will be lower.
Fully powered bundles
Next we will delve into a little bit of data analysis to determine a very useful rule of thumb.
Imagine that you are fully powering an existing bundle of cables. You don’t know exactly how many cables are in the bundle. You also don’t know what category the cables are. Let’s say there is a mix of Category 5e, Category 6, and a few Category 6A. You can put your hand on the cable bundle, and the outside feels warm. Is there any way that you can predict the center temperature (the hottest point) in the bundle without tearing it apart? It turns out there is, and it is fairly simple.
The estimate of temperature rise uses two calculations that are combined to get the total temperature rise at the center of the bundle. One calculation predicts the temperature rise from the outside surface of the bundle into the center of the bundle. The second predicts the temperature rise from the outside surface of the bundle out to the ambient environment temperature. These two calculations of temperature rise, when added together, plus the ambient temperature, give us the total temperature at the center of the bundle. These calculations are not that complex, and they are detailed in TIA TSB-184-A. The implication is that if we can measure the surface temperature of the bundle, we can then use that information to predict the center temperature of the bundle. That’s quite useful, as the surface temperature can be measured once the bundle is powered up, with a fairly decent remote thermometer or even a thermocouple.
For standard PVC UTP cables, it turns out, there are two things you don’t need to know at all. The first is how much power is being supplied. The second is what types of cables are in the bundle. For any given bundle size the temperature rise is determined by the power and the thermal resistance profile of the bundle. We don’t care how the heat is generated or how it is dissipated; we only care about the temperature. Because all we are interested in is the temperature rise, we don’t need to know the details of the cable construction or the power. This will be demonstrated by observing the results of these calculations.
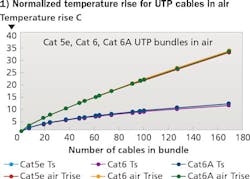
We are going to assume that all the cables are powered, and therefore our prediction based upon surface temperature will give a reasonable approximation of the center temperature. Figure 1, titled “Normalized temperature rise for UTP cables in air,” shows temperature rises versus bundle size (number of cables) for Category 5e, 6, and 6A cables in an air installation, with all pairs powered. In this graph, the center temperature rise has been equalized to 15 degrees for all three cable types for a 61-cable bundle. These curves are labeled “Trise” (Temperature rise). That is the total temperature rise of the bundle above ambient. That same figure also shows the outside surface temperature rise of the bundle, labeled Ts, for the same cable bundles. Notice that the curves all overlap almost perfectly. That means that for a given temperature rise, it doesn’t matter what cable type is used, as long as it is UTP. Shielded cable types have a somewhat different profile. They follow the same rules, they just don’t overlap the UTP curves as neatly.
Figure 1 shows us that for any given bundle size, if we know the temperature rise at the surface of the bundle, Ts, we can figure out the temperature rise at the center of the bundle, and it is the same for all standard UTP cables. For example, if you have a 100-cable bundle, and the surface temperature measurement is about 9 degrees above ambient, the center temperature will be 22 degrees above ambient. For any measured surface temperature, you can calculate the center temperature using the TSB-184-A equations. But what if you don’t have a programmed calculator handy, or a spreadsheet and you only have a general idea of how many cables are in the bundle?
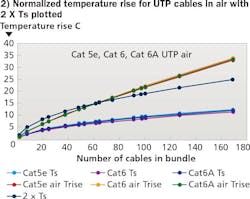
Here is a simple rule of thumb: The center temperature rise (Trise) of the bundle is equal to approximately two times the surface temperature rise (Ts) if the bundle is in air. Figure 2 shows this calculation plotted on top of the Trise curves.
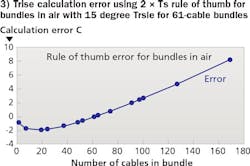
Now before you get too excited, remember this is an approximation. The 2 X Ts calculation is most accurate for the 61- to 64-cable bundle sizes. For smaller bundles it estimates higher than actual, as we can see in the graph, and for larger bundles, it estimates too low. For really large bundles it is not a very good predictor at all. But remember, fully powering such large bundles has certain practical limitations due to the power required, so you are not likely to run into 10-degree surface temperature rise on large bundles unless you are inputting loads of power. For bundles smaller than 61 cables, the maximum error is about 2 degrees, and it is to the safe side. The predicted temperature rise is higher than the actual temperature rise. The 2-degree maximum error also extends up to 91 cables, but to the “unsafe” side. So, as with most “rule of thumb” estimates, you have to know their limitations.
The error prediction values also vary with the measured temperature rise. If we calculated the error as a percentage, it would be constant for different temperature rises, but it would be a fairly large percentage error compared to the actual temperature rise, so it isn’t very helpful to calculate it that way. Using a 15-degree temperature rise for 61 cables agrees with our temperature rise table for Category 5e cables at 1A per pair, with all pairs powered. That’s 100W powering, so these example calculations are maximums. You can see that you would not want to exceed 100W powering on all cables in the bundle unless you limit bundle sizes to less than, say, 7 cables.
A few things to consider when measuring bundle surface temperature.
- Temperature rise calculations are based on surface temperature measured at the top of a bundle, the warmest part. Measuring at the bottom of the bundle, which is probably the most convenient, will lead to a lower estimate, which may not be accurate.
- Laser thermometers have a target spot size that must be considered when making remote measurements. More expensive models have a smaller spot size for a given distance and will yield more accurate readings. It is important to understand the area over which the temperature is averaged when making a temperature measurement.
- When not all of the cables are powered in a bundle, the above method will only work if the powered cables are evenly distributed within the bundle. If they are all to one side, or all in the center there could be higher than predicted temperatures due to measurement error and the inherent limitations of the modeling.
- 26-AWG cables, shielded cables, and perhaps all FEP-constructed cables will have somewhat different temperature profiles, so if you have these types of cables, the simple calculation may not be close enough. For shielded cables, however, the bundle surface temperature would be higher compared to the center temperature than for UTP cables, because there is better heat dissipation from the core. Therefore the 2 X Ts rule results in overestimating the actual temperature rise.
Cables in conduit
These calculations can also be applied to cables in conduit.
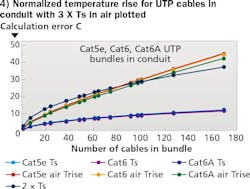
If a bundle of cable enters a conduit, how does that affect the temperature rise? First, it is impractical to measure the surface temperature of the conduit, or the surface temperature of the bundle inside of the conduit. The conduit temperature rise calculations are based upon bundle surface and center measurements within the conduit. What we would like to do, would be to measure the surface temperature of the bundle in air, before it enters the conduit, and use that measurement to predict the temperature of center of the bundle within the conduit. We can indeed do that, because it is still carrying the same current. The temperature rise in conduit is higher than in air. It turns out it is roughly three times the bundle surface temperature in air. This is shown in Figure 4, with the 3 X Ts estimate already plotted on the total temperature rise curves for the three cable types. Figure 4 shows the total temperature rise inside the conduit compared to the bundle surface temperature rise in air. Note that all of the curves still basically overlap. The best estimate using the 3 X Ts estimate is for bundle sizes between 74 and 100 cables, larger bundles than in the air. This also results in a slightly higher prediction error for the smaller bundle sizes but about the same error for larger bundle sizes.
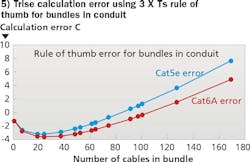
The plot of the maximum error based on Category 5e cables is shown in Figure 5. The maximum error is now -3 degrees for a 19-cable bundle. In the other direction, the +2 degree error extends up to 100-cable bundles. The Category 6A plot has slightly higher negative error at low bundle sizes, but much less at high bundle sizes-less than 5 degrees-due to lower temperature rise.
Power input to cable bundles
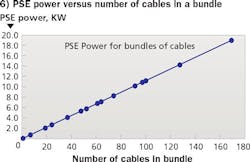
As shown in Figure 6, the power required to heat up these bundles increases linearly with the number of cables in the bundle. These calculations are assuming a 52V PSE voltage, a current sufficient to raise the temperature 15 degrees in air for Category 5e cables in a 61-cable bundle (about 0.98A), and a 90-percent efficiency for the power supply.
We can see from Figure 6 that it will take roughly 10kW to power a 91-cable bundle. Most of the power of course goes to the PDs. That would be about 3.8 24-port power supplies, all feeding the same bundle of cables. To power a 169-cable bundle with the same voltages and currents will require almost 20kw and result in a temperature rise of that bundle of roughly 33 degrees above ambient in air. It is assumed that 169 cables in a conduit is fairly impractical to implement, except for a floor or wall pass-through. For these types of installations, with such high power and large bundle sizes involved, a more-detailed engineering analysis is highly recommended.
If you were wondering what the power-vs-bundle-temperature-rise looks like for Category 5e cables in air, wonder no longer. Figure 7 shows the PSE power required to raise temperature in increasing bundle sizes but with temperature rise as the x axis. Note that for higher temperature rises in cabling, the increase in attenuation and reduction in maximum length really should be taken into account. The TIA-568-C.2 standard fully covers the reduction in reach at higher temperatures, whether that’s just ambient or due to cable heating.
Table 5 shows overall cable length reduction due to elevated temperatures (up to 60 deg. C). Regardless of how the cabling gets to this temperature (elevated ambient, PoE heating, sun-baked conduit on the roof), these length reductions need to be considered.
Connectors
Steady state connector performance is not discussed much because for IEEE-style PoE applications, the current capacity of connectors easily exceeds the current capacity of the cables. There are some things to think about, though.
Figure 8 is a chart of connector current capacity requirements that is derived from ISO/IEC specifications, which are also TIA requirements by reference.
Key features of the graph are that all conductors are carrying current simultaneously, the capacity diminishes with higher ambient temperatures, and goes to zero at 90 C ambient. At 20 C ambient, the current capacity per conductor is 1.552A. At 45 degrees C, the current capacity is reduced to 1.245A. One can conceivably flip this into a maximum temperature rise chart for connectors.
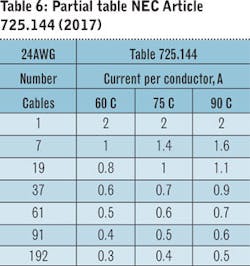
From Figure 9 we can see that 1.5A current per conductor would raise the connector temperature a little more than 8 degrees. The NEC ampacity tables were developed based solely on the horizontal cable type, and do not consider connectors. An example of the NEC 725.144 table, for 24 AWG cables, is shown in Table 6.
Table 6 shows that for 1 cable and 7-cable bundles, the current allowed would exceed the connector current capacities allowances. The allowed connector current at 30 C ambient (used by NFPA) is 1.437A.
The other issue with connectors is plugging and unplugging under load. The IEEE PoE application does not turn on power until it recognizes a powered device, so plugging under load is not really a problem. But there is no way to anticipate unplugging under load. This means that with two-pair power, PoE+ with potentially 1A per pair, the entire 1A current may try to flow through one connector contact at that last instant as the plug is being removed. This is a known issue, and there are connector designs that improve the mating conditions even after an arc has been experienced across the connector contacts.
With four-pair power, that current doubles to nearly 2A, all potentially on a single conductor while disconnecting. This can create quite an arc, depending on the inductive load characteristics of the cabling. Even though there are draft specifications to qualify connectors under these conditions, the best advice: Turn off the power before disconnecting the load.
To summarize the observations made in this rough guide …
- Two-pair power, PoE and PoE+ will not raise cable temperatures or cause length reductions of any significance.
- Four-pair power supplying up to 60W will in all likelihood result in cable bundle temperatures that do not exceed the standard maximum of 60 C, regardless of bundle size.
- Four-pair power supplying up to 100W can easily exceed cable temperature ratings, but it requires a lot of power to do so.
- If you are concerned about bundle temperatures in air in the field, you can measure the bundle surface temperature, subtract the ambient temperature, double the result and add the ambient back in to estimate the temperature at the center of the bundle.
- For bundle temperatures in conduit in the field, you can measure the bundle surface temperature in air, subtract the ambient temperature, triple the result and add the ambient back in to estimate the temperature at the center of the bundle.
- For four-pair power, turn off power before disconnecting to avoid arc damage to the connector contacts.
Sterling Vaden is vice president of advanced technology at Surtec Industries and principal of Vaden Enterprises. He can be reached via email at [email protected].
