It means testing dispersion, reflectance, and loss to limits. Decide the accuracy you want on measurements, and measure all the fibers you can.
Testing fiber during network upgrades is nothing new; an optical time-domain reflectometer (OTDR) and loss test have been the normal tools for testing fiber during installation and network provisioning. But with 10- and 40-Gigabit Synchronous Optical Network (SONET) and Ethernet rates being deployed, other parameters of the fiber must be measured and managed to guarantee the “five 9’s” (99.999% uptime) performance that the world expects.
In this article, I will guide you through the new language of fiber testing, including reflectance and dispersion, as well as the very real limits they pose at gigabit rates. I will also introduce the concept of certification versus characterization, i.e., certified for 10-Gigabit transmission.
It’s all good
In the beginning, there was light, then fiber. And it was all good.
Compared to other technologies we use today, fiber optics is starting to sound mainstream after its genesis in the 1980s. The first tools for testing the integrity of these links involved connecting an optical source at one end and a calibrated power meter-set to the same target wavelength-at the other end. Loss was measured and monitored to ensure enough transmitted signal got down the fiber to the receiver.
In the late 1980s, the OTDR was introduced as a primary tool for measuring fiber length, determining fiber attenuation (in dB/km), locating breaks, verifying splice loss, and checking for bending (determined by higher loss at higher wavelengths).
In the 1990s, transmission rates were well below gigabit speeds. Loss and integrity were the main parametrics of link quality. Thousands of OTDRs and tens of thousands of power meters and sources were manufactured for installation and maintenance of early links.
The need for speed
The introduction of the Internet and ever-cheaper computers caused an explosion in the amount of computer data that network providers needed to carry. About the year 2000, the scales tipped globally in the volume of data versus telephony traffic transported. Data continues to have a much higher growth rate. To transport the aggregate volume, higher speeds were needed across the networks. The core networks (metro and long-haul) see higher data rates first.
Going to the next level
Network providers each have different business cases for installing higher rates, but when network transmission equipment prices fall so they can provide four times the existing rate at twice the cost, it makes sense to provision the higher rate. Other times, lack of available fibers on a certain route necessitates the need to put more traffic on an existing fiber.
All of these situations cause deployment of 10- and 40-Gbit/sec transmission systems. If SONET is being used, these are labeled OC-192 and OC-768 rates, respectively.
Blink, and you’ll miss a lot
In today’s megapixel and gigabyte world, it’s easy to forget how fast data is switching at 10 and 40 Gig. If you are impressed with nanotechnology, then hold onto your stopwatch, because transport networks are way beyond that.
Let’s look a little more closely at the speed of transmission. Bit width is length of time needed to register a single digital one or zero. For a SONET system running at OC-48 rates (2.5 Gbits/sec), the bit width is about 0.4 nanoseconds (ns). That’s fast. Now increase the transmission speed a factor of four to 10-Gig (OC-192). That bit width is reduced to only 100 picoseconds (ps). A picosecond is 1/1,000th of a nanosecond, or one-trillionth (0.000000000001) of a second.
With bit widths in the low picosecond range, measuring impairments that affect transmission requires resolutions in the sub-pico second range. One-one hundredth (0.01) of a picosecond is 10 femtoseconds.
Return loss and reflectance
As speeds increase, a system’s susceptibility to returned energy and echo signals, caused by high reflectances throughout the link, increase as well. Return loss is a measure in dB of the total amount of energy reflected back by a link.
Reflectance is a measure also in dB of energy reflected at individual events, such as connectors or mechanical splices. As we move to 10- and 40-Gig systems, both values should be better than 30 dB, and a good goal is 40 dB across the network.
Strong reflections can cause changes in modulation as well as increased noise at the receiver end, increasing bit error rate (BER). An OTDR that can measure high and low reflectance is the best tool to certify your link for reflectance and to locate problems.
Dispersion dilemma
Error-free digital transmission depends on receivers identifying a one or zero correctly. Dispersion is a small effect in fiber that becomes a larger percentage of the bit width as speeds arise. It affects the receiver’s ability to clearly distinguish bits.
If we imagine a data stream as a series of pulses, then dispersion results in the pulses spreading out, making the receiver’s decision on what is a one and what is a zero more difficult. The result is a higher BER.
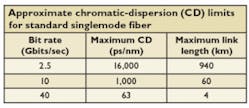
Effects like chromatic dispersion (CD) and polarization mode dispersion (PMD) result from the fiber’s refractive index not being constant in some way or another. CD is the variation in speed of propagation of a lightwave signal with wavelength. It leads to spreading of the light pulses and, eventually, to inter-symbol interference (ISI) with increased BER.
Simply put, any signal consists of different wavelengths, and CD causes some wavelengths to travel slower than others, resulting in different parts of the pulse arriving at different times and the pulse spreading out. CD is a result of the combination of material dispersion and waveguide dispersion. The total delay caused by CD is measured in picoseconds for a fictional signal that has wavelengths spread over a nanometer-i.e., 1,000 ps/nm, even though most transmitters use a more-narrow wavelength range and see a smaller actual delay.
PMD is caused by the small difference in refractive index for a particular pair of orthogonal polarization states-a property called birefringence. I know it sounds like reading glasses, but this means that the speed of light depends on the path it takes along the fiber.
In contrast to an ideal fiber, a real fiber and especially fibers manufactured before 1994 can exhibit several kinds of imperfections, such as impurities and fiber asymmetry. These imperfections are partly inherent to the manufacturing process of the fiber cabling, and partly caused by the quality of fiber deployment.
When light is coupled into a fiber, it takes different paths traveling through the fiber. Differential group delay (DGD) is the difference in time that the light pulse components need to travel along the fiber path. The average of DGD over wavelength is the PMD.
Now that you have been introduced to CD and PMD, why do you need to measure it? Simply, because the delay caused by dispersion becomes a significant part of the bid width. The allowable limits for CD and PMD become increasingly restrictive at higher bit rates.
It is worth noting that CD varies greatly with fiber type, and a good reason to measure CD is so you can determine the type of fiber with which you are working. Also remember that manufacturers are using different modulation schemes to push the limits. The fact remains, however, that characterizing your fiber’s CD and PMD becomes important once your transmission rate reaches 2.5 Gbits/sec.
Complex effects, easy measurements
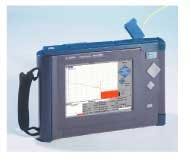
The good news is that these new measurements are not difficult to make. A useful CD measurement can be as easy as connecting to one end of the fiber and running an automatic measurement. The total CD at the wavelength you will use, as well as the fiber type, can be displayed. If you exceed the manufacturer’s limits because of fiber length, then information is provided to specify CD-compensation modules.
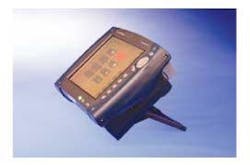
A DGD/PMD measurement has also become a one-button, single-person measurement. A technician can hook up a source to one or all of the desired fibers at the nearest end of the link, then travel to the far end, hook up fiber sequentially to the DGD/PMD analyzer, and measure DGD across wavelength; its average (PMD) is displayed automatically. Even pass/fail limits can be entered, certifying the fiber with a check-mark, or indicating its failure with an X.
Match fiber to service
With known limits, technicians and users will want to know if links will support a service. Pass/fail limits on measurements can help anyone do this. By testing fiber for loss, reflectance, return loss, and dispersion, you can certify individual fibers to support certain speeds of service.
Consider certifying all your fibers and allocating each existing service to the worst fiber that can still support it. For example, if you have an OC-12 link, use the fiber with the worst PMD value. It won’t affect service, and it frees up fibers with better PMD performance for higher speeds or future rates.
Fiber certification means testing dispersion, reflectance, and loss to limits. Decide the accuracy you want on measurements, and measure all the fibers you can. Save the best fibers for tomorrow. You will be glad you did.
Researchers are constantly working on ways to get around dispersion and raise limits, especially for CD. But until then, certification with tools that give you repeatable results is your key to turning up with confidence.
PETER SCHWEIGER is with Agilent Technologies (www.agilent.com).


