Manage your fiber-optic network using software

Current methods of manual record-keeping and limited electronic management are not adequate to maintain the vital, mission-critical medium represented by a fiber-optic network.
Randall S. Anderson,
Advance Fiber Optics
With the advent of the information superhighway, the state and expansion of your fiber-optic network will have a bearing on the ultimate success of your company. Because network technology is still developing, the procedures, tools and documentation are still being developed and defined. In other words, everyone in the industry is still trying to figure out what we want and need to do, while technology is rushing us into the twenty-first century. One thing is certain: We need to learn how to manage and maintain our networks to keep pace with growth.
That need was brought home at Advance Fiber Optics (AFO) almost two years ago when a customer requested that we compile an audit of the company`s networks in several cities. The project involved documenting six existing fiber-optic networks in which the volume of cable in each network ranged from 10 to 200 miles. Each network had a wide number and range of users, and the required data included mapping cable routes and access points; defining splice keys, types of cable and enclosures; and recording fiber connections in distribution frames and transmission equipment.
The project involved not only gathering and recording data, but also required us to design a system to store the data, so that it could be useful to engineering, marketing, sales and administration. A user-friendly software package had to be developed for facilities maintenance and asset management.
It took programmers nearly six months to complete a beta-version software package. Then it took six employees nearly nine months to complete the task of data-gathering and input as they shuffled through piles of drawings, maps and other records to piece together these network layouts.
With the project completed, the customer has maps of its networks and all the data included in the maps. With the click of a mouse button, end-users can obtain information such as total cable and fiber used in a network. The documentation system provides invaluable information for all users:
- Contractors, who perform the cabling work, gather data and use the information as they install and maintain the network.
- Technicians can manage and maintain their networks more effectively.
- Engineers can plan and design as the company continues to expand and bring new users onto existing networks.
- Sales staff can show potential customers the advantages of new services, using reports and graphics from the database.
- Marketing personnel can determine new opportunities.
- Administrators can analyze what is in place and any associated margins.
- And the entire company can communicate more efficiently because everyone is looking at the same data on his or her computer screen.
In addition, engineers in remote areas are empowered to suggest network modifications by making temporary adjustments to drawings and sending them over the computer network to management for approval. An engineer in Phoenix can transmit his or her drawing almost instantaneously to the desktop of management in Portland for review.
The key is that everyone in the organization uses the same database, maps and drawings from the software developed: OSP InSight. By using the same accurate reports, mapping graphics and data, management has better tools to make decisions.
Data management, however, needs to become data modeling, which is the process of using data to show actual and theoretical characteristics of a system. For example, airplane manufacturers spend hundreds of thousands of dollars annually to build scaled models of aircraft that are used in wind-tunnel tests. This modeling is much less expensive than building an actual airplane to test -- it saves manufacturers millions of dollars while still yielding the same information. The modeling system used in AFO`s software is similar to this approach.
Virtual network
OSP InSight is a model of your network system -- albeit a digital model -- that resides in your computer. When built properly, the model can be used to determine many of the network characteristics; for example, if you believe that a certain number of fibers extends from one building to another, you can check this, even before performing any optical time-domain reflectometer (Otdr) tests. In fact, this virtual network can be built long before the actual system and can be used to identify any potential problems. Of course, once the actual data is input, there will be a true representation of the network.
A successful electronic data-modeling system for a fiber-optic network needs to focus on each fiber in the network. Such a system also relies on the regular input of field notes and engineering updates to create and maintain an up-to-date database. In addition, it should provide the user with easy access to pertinent reports, engineering drawings and network maps for up-to-date information on the status of the network.
The documentation should focus on what is inside the cables, not just where the cables are placed. For example, you may know that there are cables close to a user at a certain location; however, you may not know which fibers are available inside those cables. Using a network-modeling system, you can call up a map of the particular network and select any cable by using the mouse to click on the cable. This lets you review where each fiber in that cable terminates and also which end-users are served by each fiber.
In addition, when you make changes to the network configuration, the software automatically makes the adjustment to the database records: No more moving from one splice point to another to change records when only one splice point has changed. This is possible because of "splice keys," which identify cables that are spliced together at a given point as well as which fibers within the cables are spliced. Just as in an actual network, the splice locations are where fibers are crossconnected to serve specific termination points. You can then generate a complete report of the network -- a click of the mouse will draw the actual path a fiber takes throughout the network.
Just as a picture is worth a thousand words, a true documentation system allows you to view any type of document relating to the network. In today`s competitive marketplace, companies typically use outside contracting services to provide engineering drawings for construction projects. Some projects require the efforts of multiple contractors for these services, which can mean different formats of engineering drawings. These drawings have to be organized, and it is important that your documentation system provide this capability.
Using OSP InSight`s mapping function as a key map for CAD drawings, you can determine, at a glance, if more-detailed information is available for a certain location within the network: Areas where more-detailed drawings exist are outlined with a dotted line. Then, when you call up a CAD viewing program, you can view and also redline the drawing.
Digital photographs can be linked to the map in the same way. If a picture of a certain fiber distribution frame exists, and you want more information for a portion of the network, the system would notify you if a picture is associated with that location. Other pertinent documents might include hardware and equipment brochures, lease agreements and contracts.
Begin with data gathering
The entire process of documenting a communications network starts with the data gathering. If this data is incorrect or missing, the integrity of the database will be compromised. It is important, therefore, to ensure that this part of the process is conducted with special care. The best approach is to keep everything simple.
The first step in the process is to ensure that contractors complete one-page forms for each location where they are working. The contractors keep these forms on a clipboard or in a notebook and record the data as they complete any moves, adds or changes to the network. Items may include addresses, traffic notes, cable type, hardware types and cable sequentials, for example.
This is a simple procedure but requires that end-users enforce the accurate gathering of data. In fact, some organizations use in-house personnel for this task.
Fault location made easy
A software system is also useful for maintenance, troubleshooting and locating fiber faults. However, some fault-tracking systems identify the fault location only in terms of cable length, not physical location. With this next-generation data-modeling package, however, you can record the cable sequentials, or wall-to-wall values, or other physical attributes, including the optical lengths provided by an Otdr.
Once the data is input, fault-finding is relatively straightforward. And, because each fiber`s individual routing is also recorded, finding a fault on any one fiber is easy.
Reports -- the key to network management
Managing anything as complex as a network requires that data be available quickly and in a format that is easy to understand and, when necessary, distribute to others. Obtaining basic information, such as plant size, type of equipment and facts on how everything is connected, takes a great deal of time and effort when using manual record-keeping methods. When this information is filed electronically, it can be accessed and printed quickly and easily. Using the report utility and relational database software, you can recall and print pertinent data as reports.
To get the most from your software package, you should first determine the needs of the organization to establish how the data will be obtained. Then you can discuss with the end-user the type, depth and accuracy of data required. Always remember that the data reported by the software will only be as good as the information entered in the system. Examples of available reports and their functions include:
- Cable placement -- total footage of cable placed
- Fiber assignments -- fibers available at any fiber distribution frame
- Geographic queries -- the number of cable feet in a certain geographical boundary
- Fiber cable assignments -- fibers and where they go in any cable throughout the system
- Customers/equipment -- types of equipment throughout the network and what fibers they are connected to.
Application Makes Network Data Management Possible
OSP InSight is a documentation system for fiber-optic networks that uses software packages for mapping, computer-aided design (CAD) and database applications, all in a Windows environment. This application, developed by Advance Fiber Optics (Salt Lake City, UT), integrates these software packages to provide viewing of CAD drawings, photographs and documents, a relational database, and desktop mapping with the capability for geographic queries.
This system provides engineers with the information they need to maintain fiber-optic networks; for example, materials and type of cable used, total cable and fiber footage, fiber status, splice location and description, and geographic fault location via optical distance, for every terminated fiber throughout the network.
By using this type of cable management system as an integral part of your network`s design, your company can stay abreast of technology as it continually changes the dynamics of the fiber-optic network.
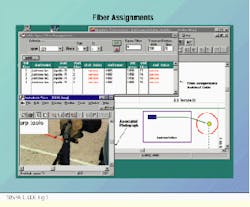
Using an associated document--in this case, a photograph--you can view fiber assignments and where they terminate within any cable throughout the network.
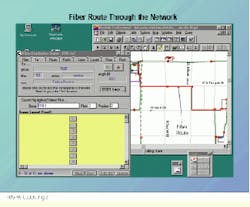
By clicking on the fiber in the frame, you can view the route that the fiber takes throughout the network.
Randall S. Anderson is director of engineering at Advance Fiber Optics, Salt Lake City, UT.