Optical fiber testing to the last nanometer
by Charles Lohrmann
An interferometer can provide the most accurate, detailed testing of connectors, and is also an effective in-the-field troubleshooting tool.
When viewing an Optical Time Domain Reflectometer (OTDR) trace, you encounter high attenuation at a connected pair—a fault. You may also encounter a ghost, which is a large reflective event at a point in the passive fiber link where there is a change in media (index of refraction). This occurs at the connector or the end of the fiber—the change from glass to air.
Provided the OTDR is properly set up for the test, the ghost shows the location of the fault. But an interferometer can determine which connector is defective.
In this article, we'll discuss how an interferometer can take OTDR testing to the next level, accurately measuring the radius of connector curvature, offset of polish, and fiber height.
Ghost busting
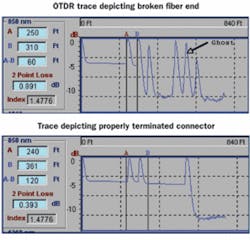
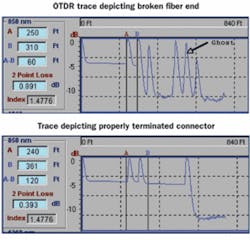
In the change from glass to air, energy reflected back to the OTDR is of such intensity that the light pulse is reflected off of the connector at the OTDR and is again returned a second time. As the OTDR converts the travel time of the light pulse into distance, the reflective event is painted on the screen a second time—thus, a ghost.
The first figure (at right, top) shows the reflective event on an unterminated fiber, while the one below shows the same event with a properly terminated connector. These figures show the extreme. But what if the connector looks "good" in a fiber scope? Does the ghost then represent a fault? Provided the OTDR has been set up properly (the pulse width and pulse duration appropriate for the fiber length), then yes, a ghost represents a fault at the connector.
For most of us, when we look into the fiber scope and the end face of the connector looks perfect, we determine that the connector is "good." While true, what we're seeing is the two-dimensional view of a three-dimensional object. Fiber connectors, such as the ST, SC, and LC, are domed, while connectors such as the APC, MPO, and MPT have a different configuration.
Determining the connector's role
Before we can determine the cause of the fault, we need to determine what part the connector plays in the passive optical fiber link. By definition, the purpose of the connector is a temporary connection between two optical-fiber links to couple the light with a minimum of insertionloss (attenuation) and reflectance.
The primary connectors in use today in the enterprise LAN are what are termed Physical Contact (PC) type. The fiber connector is polished so that the fiber is at the center and the highest point, and is first to meet. There is no air gap, fibers compress until the ferrules contact, and the ferrules take the majority of the compressive force.
One key optical parameter for connectors is fiber attenuation. It is measured in dBm per mated pair (the light passing through one connector is meaningless, as it is going nowhere). Attenuation is the sum of losses caused by:
- Overlap of the fiber cores;
- Alignment of the fiber axis;
- Fiber Numerical Aperture;
- Mating space between connector barrels;
- Reflection at fiber ends;
- Angular misalignment;
- Axial alignment.
Overlap is the sum of several different effects—the axial and angular alignment of the two fibers, connector and coupling, variations in core diameter, concentricity of the core within the cladding, and the eccentricity of the core.
For axial alignment, a good rule of thumb is an offset of 10% equals 0.6 dB loss. For a 50-µm fiber, that equates to 5 µm; however, for singlemode, that distance is only .8 to .9 µm. When the fibers are out of angular alignment (in the field, the most common cause is a defective coupler), the light entering the second fiber is at a steeper angle; thus, some of the light is refracted into the cladding.
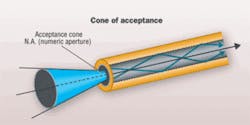
Fiber Numerical Aperture (NA) is defined as the acceptance angle of the light that enters and is propagated in the fiber. This has also been termed the cone of acceptance, as shown in the figure on page 8. The light exits the fiber in exactly the same cone as it entered.
Reflections, more properly termed Fresnel reflections, occur when light exiting the fiber encounters a material with a different index of refraction, and are the result of the change from glass to air. Fresnel reflection loss is also affected by distance—the greater the distance between the fiber ends, the greater the loss. Internal connector reflections can cause spurious modulation and noise in laser light (feedback lasers), which mayresult in system failure.
Reflections of a ghost
Reflection noise is an important concern in analog video as it may saturate the transmission device, causing system failure. As the distance increases, so does the corresponding loss. These reflections, with enough magnitude, are what we see on the OTDR trace as a ghost.
As we have seen in the forgoing discussion, that "little, insignificant" connector has a great deal of significance in the passing of the signal through the passive optical fiber link. The question now becomes, how do you test an optical-fiber connector to the parameters just discussed?
Up until a few years ago, we could not. It was done in the laboratory, using a test set called an interferometer. The tester was highly complex, susceptible to movement (it sat on a large concrete base for stability), and was not considered for field use. Several years ago, however, two companies—FIBO (www.promet.net/) and Norland Products (www.norlandprod.com/)—developed a field transportable unit. With the development of the field transportable interferometer, (it has been in use in the laboratory for many years), you now have the ability to test terminated connectors in the field.
The interferometer uses the principal of light wave interference, which occurs when two or more waves of the same frequency or wavelength combine to form a single wave whose amplitude is the sum of the amplitudes of the combined waves. Constructive and destructive interference are the most striking examples of light wave interference. Constructive interference occurs when the light waves are completely in phase with each other (the peak of one wave coincides with the peak of theother wave). Destructive interference occurs when the light waves are completely out of phase with each other (the peak of one wave coincides with the trough of the other).
Interferometers can produce images and data to sub-micron accuracy using the principle of wave interference. They use a single coherent light source, and to produce two separate light waves for interference to occur, a partially reflective beam splitter is used. As the light hits the beam splitter, one wave front is transmitted through the beam splitter, through an objective lens, and to the object being examined. Theother light wave reflects off of the beam splitter onto a stationary reference mirror.
After each light wave has been reflected off of the surfaces(the surface of the object being examined and the reference mirror), the waves combine to produce constructive and destructive interference waves--also known as light and dark fringes, respectively. Each dark fringe identifies a specific height onthe surface of the object being examined. Typically, two adjacent dark fringes have a height difference of half a wavelength of the light being used, and so can show a surface contourof the connector end face that's similar to the concept of con-tour maps used to show different elevations of a land surface.
Tool testing and measurement
The interferometer tests several components of the connector. The three major measurements are the radius of curvature, offset of polish (also called Apex offset), and fiber height.
This radius of curvature portion of the test determines the overall diameter of the best-fit sphere and its relationship to the actual end of the connector under test. Therefore, the spacing and diameter of the circular fringe pattern are directlyrelated to the radius of curvature.
The offset of polish determines the actual centerline of the fiber and its relationship to the actual centerline of the best-fit curve. With the ideal connector, both centerlines would be the same.
The fiber height portion of the evaluation determines the amount of fiber that is above or below the end of the connector end face.
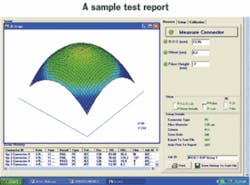
Based on these three parameters, a test report may be generated as shown in the figure above. In this case, the connector is within limits for all of the tested parameters; however, the basic question remains—why field-test the connectors? To answer this question, you'll need to examine the condition that may occur when you join two connectors, and the relationship between the two.
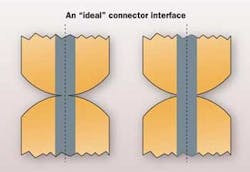
The objective is minimum loss as well as minimum reflectance. Optical-fiber connectorization is based on the principal of Physical Contact (PC). When two "ideal" connectors are joined, the interface should be as shown in the figure "An ‘ideal' connector interface" (page 12).
When using the PC concept, the only concern is the center of the connector. The fibers are polished so that they are at the center and the highest point and are first to meet. There is no air gap. The fibers compress until the ferrules contact andabsorb the majority of the compressive force.
Using interferometry helps guarantee optical performance by providing consistent quality control of the polishing process. This assures long-term stability when connectors are exposed over time to changes in temperature, pressure, and the affects of vibration.
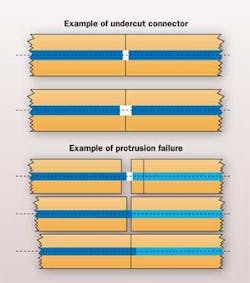
So, what is a "bad" connector? It can be one of three types: Undercut, which is the result of overpolishing; offset; and protrusion, which is the result of under polishing.
Undercut results in an air gap between the connectors and a corresponding increase in both attenuation and reflectance. In this instance, the glass within the connector may "piston" over time. This is probably the failure most often seen. (This condition is generally caused when a high magnification scope is used and the tech tries to get the last little scratch off of the end face of the connector).
The second condition, offset, may be caused by not holding the polishing puck tight-and-square to the lapping film during the polishing process. With the use of today's pre-radiused connectors, and proper polishing technique, offset should not be a major problem.
In the last type of failure, protrusion, the fiber is protruding from the end of the connector. When the end face of one connector meets with the second, something has to give. As shown in the figure on page 13, the result is push back—the fiber on the protruding connector pushes thefiber on the second connector back into its ferrule. This is the best case. Have you ever wondered why a connector that was good yesterday was found shattered today? Yes, under pressure, glass will break and usually at the most inopportune time.
Factory-polished, or not?
At this point, I can see many of you thinking, "all of this is great, but we only use ‘factory-polished' connectors." But what constitutes a factory-polished connector? What is the manufacturing process? Some are machine-polished; however, as more and more of these products are manufactured off shore, a great many are hand-polished in the factory. Factory quality control is dependent on a manufacturer's quality control program. Even so, quality control depends for the most part on statistical testing. If a representative number within a batch pass, it is assumed that the remainder will also pass. (Remember, that is why the U.S. passed the "Lemon Law".)
When and which connectors should you test with aninterferometer? The answer is about the same as the answer to "when should you use an OTDR?" (See "The right tools for accurate fiber-optic testing," CI&M August 2008, pg. 13.)The primary test for any optical fiber passive link remainsthe Optical Loss Test using the Optical Loss Test Set (OLTS).A part of this test set includes the reference cables, whichshould be of the highest quality.
This is one of the reasons why the TIA has recommended the use of singlemode-grade connectors for multimode reference cables. It has been my experience over the years that once the reference cables (which came with the test set) are worn out, the replacement is not a new reference cable from the test set manufacturer, but any patch cord available. OLTS testing should also include the testing of the launch and receivecables for the OTDR.
You do not need to test every connector that you install. Follow the guideline normally applied to OTDR testing requirements—they are about the same. First priority would be any circuit where low loss and reflectance are a priority—bothdata and video. Next are the backbone circuits that ardesigned for transmission at high data rates—10 GB and above. This applies not only to the permanent part of the circuit but also to the patch cords. Short circuits, such as fiber-to-the-desk-top, once they have passed the optical loss test, should not require any further testing.
The interferometer is also an excellent troubleshooting aid. If you encounter a circuit that shows a higher than expected loss or ghosts, in most cases, the fault is in the connector. When the connector looks good in the fiber scope, while the OLTS will not give the answer, the interferometer will.
When both the connectors pass, the only remaining item is the coupling test. The interferometer is the only methodthat I know of that will pinpoint this defect.
Another use for the interferometer is fiber connectorization training. I began using the interferometer in our OSP fiber course about two years ago and have found that, with even the "old fiber hands," there is a tendency to over-polish. Over-polishing results in undercut and distortion of the connector end face, thus generating higher loss and high reflectance. If the technician can do connectors that pass the interferometer in the training, the same result should show up in the field.
Lastly, if you who use crimp-style connectors or pigtails, the interferometer is an excellent quality control tool. When you receive a new batch of connectors or pigtails, perform you own quality control test. If the first sample shows bad connectors, test the remainder of the batch. It is much more cost-effective to catch a problem in the shop than after the connector has been installed in the field.
Tools of assurance
Using common troubleshooting tools—a visual fault locator (VFL), OLTS, OTDR, and the interferometer—will ensure your customer has the highest quality optical fiber networkpossible.
CHARLES C. LOHRMANN, RCDD/OSP, TPM, RITST, BICSI master instructor, is chief financial officer at TSI Compass International Limited Inc. (www.tsicompass.com). NEIL WAGMAN is sales manager with Norland Products Inc. (www.norlandprod.com).
