Sensor technology helps keep computing environments running efficiently
By Patrick McLaughlin
In data centers especially, but also in other computing and networking environments, the data generated by sensors is enabling network administrators to quickly and effectively make changes to maintain or improve the efficiency of the network’s operation. By producing and reporting data, sensors are foundational elements in the progression through which data becomes information, information becomes knowledge, and knowledge becomes intelligence.
The United States Department of Energy gives credence to sensors’ value in data center environments through its Office of Energy Efficiency and Renewable Energy (EERE). On its website, the DoE EERE explains, “In the federal sector, agencies currently lease space from the U.S. General Services Administration (GSA) to operate more than 1400 data centers. Improving the energy performance of data centers supports progress toward meeting federally mandated greenhouse gas emission-reduction goals, while reducing costs and energy use, and allowing greater flexibility in future expansion by eliminating the need to provide additional power and cooling. Wireless sensor technology provides a cost-effective and facilities-friendly way of helping data center operators visualize and implement system changes that reduce overall energy consumption.”
The EERE made these statements after evaluating a set of technology that included a network of wireless sensors, including branch power circuit monitors, temperature sensors, humidity sensors and pressure sensors, along with an integrated software product to help analyze the collected data. “The wireless sensor network provided real-time data center conditions needed to optimize energy use and achieve substantial savings, all with minimal impact on day-to-day operations.”
Put to the test
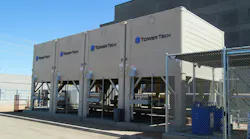
The GSA’s Green Proving Ground (GPG) program worked with the Energy Department’s Lawrence Berkeley National Laboratory (LBNL). LBNL selected the U.S. Department of Agriculture National Information Technology Center facility in St. Louis, MO as a demonstration project location, “because its baseline conditions were representative of a well-designed, well-managed data center operated by an engaged facility staff,” the EERE noted. “Sensors using a wireless mesh network and data management software to capture and graphically display real-time conditions for energy optimization were installed.” It continued that the study showed “providing real-time, floor-to-ceiling information on humidity, air pressure and temperature conditions is feasible. This data, when combined with power use, leak detection, and equipment status, could enable data center operators to significantly improve the energy efficiency of even well-managed data centers.”
The data center in the evaluation experienced a 48-percent reduction in cooling load and a 17-percent decrease in total power use, which represented an annual savings of 657 megawatt-hours. Additionally, the EERE stated, “The data center operator at the demonstration facility found that full deployment of the permanently installed wireless sensor network provides valuable real-time information needed for the ongoing optimization of data center performance. However, permanent installation of the sensor network required multiple interruptions of facility power. Recognizing this as a potentially significant barrier for some tenants, LBNL has separately piloted a smaller, portable, less-disruptive ‘assessment kit’ at four federally operated data centers, and found that the snapshot of real-time information it provides holds many of the full network’s benefits.”
The evaluation team at the LBNL “concluded that broad deployment represents a best practice that could help agencies meet mandated targets cost effectively,” said the EERE. “This technology could be applied to all data centers across all agencies, regardless of climate or location … LBNL predicts that many data center rooms could benefit from this technology … Consider how much downtime your data center can tolerate before choosing between a full wireless sensor network or LBNL’s ‘assessment kit.’”
Cooling a colo
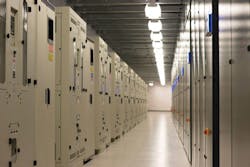
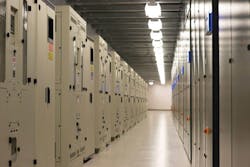
Examples of sensors helping to achieve data center efficiency exist outside the federal government as well. RF Code, which provides data center asset management, environmental and power-monitoring solutions, provides an example with the use of its solutions by Seattle-based colocation provider Digital Fortress. The deployment of RF Code’s technology-including data center infrastructure management (DCIM) software, wireless sensors and readers-was carried out in two phases. “Phase one focused on reader installation and an initial deployment of sensors that provided coverage of Digital Fortress’s most-sensitive and mission-critical areas, while phase two extended monitoring to all remaining areas throughout their facilities,” RF Code recalled.
“Once all preparations had been made, the deployment process was brief,” the company continued. “A single engineer was able to completely deploy and begin monitoring an 18,000-square-foot data center floor in just four hours. By Digital Fortress’s estimates this process would have taken several weeks had they chosen a wired solution.”
Six days after the deployment, RF Code says, it helped Digital Fortress identify a failing computer room air conditioning (CRAC) unit before it burned out. “RF Code paid for itself in the first six days,” commented Scott Gamble, IT manager for Digital Fortress. “We had early warning on what we would come to learn was a failing CRAC in a high-density area of our Seattle facility. This unit slowly leaked more than 25 pounds of refrigerant over the course of 24 hours, but reported operating at 100 percent throughout the event.
“Thanks to the real-time dashboards we could see we had an emerging event, we knew where the problem was, and we knew it wasn’t simply a device economizing. Better yet, we also knew the unit itself was misreporting-the panel on the device reported zero issues, but clearly something was wrong.”
Subsequently RF Code extended its environmental monitoring solution to incorporate data gathered from generators, cooling towers and power infrastructure. Digital Fortress is using RF Code’s R130 Dry Contact Tags, R180 4-20mA Sensors, and R120 Door Tags to extend visibility to systems that would otherwise be costly or technically prohibitive to integrate with their management dashboards. Gamble concluded, “Using RF Code we can now apply the same tags and monitor every piece of equipment exactly the same, regardless of model or age. It’s cheaper, faster and easier to use RF Code to pull and present this information than it is to try to make different equipment produce the same data in the same way.”
Wireless sensors at CyrusOne
Another case-study example of sensors combined with DCIM providing efficiency and savings for a data center is CyrusOne’s use of Panduit’s SynapSense SynapSoft Software, which is a modular cooling platform within the company’s SmartZone DCIM suite. Specifically, the Active Control feature of SynapSense brought value to CyrusOne’s Austin Data Center II. Panduit explains, “Located in the Met Center business park, this 70,000-square-foot facility is the first of an optional four-phase, 288,000-square-foot data center campus. To optimize Data Hall 1 within the data center, a 20,000-square-foot facility, CyrusOne needed to monitor temperature and humidity for its customers’ SLAs [service level agreements], and to conserve as much energy as possible.”
The Active Control feature provides energy savings and increased efficiency by continuously aligning cooling capacity with changes in IT loads, Panduit continues. “Its granular deployment of wireless sensors measure server inlet temperature and sub-floor pressure differential to manage computer room air handler (CRAH) return temperature set points and variable fan speeds.”
The Active Control feature works alongside the existing Computrols Building Automation System (CBAS). The CBAS was already wired into the facility’s Stulz brand waterside economizer units and communicated via Modbus; Panduit was able to streamline the process by sending its control set points to CBAS and having CBAS pass the set points to the Stulz units. “This setup left all the existing BMS functionality in place while providing another layer of redundancy,” Panduit says.
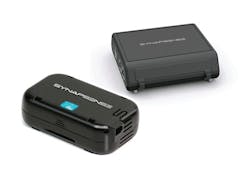
For environmental monitoring, Panduit installed a number of sensors throughout the data center’s cabinets, including temperature sensors in both the front and back as well as humidity and pressure sensors. Panduit also installed computer room air handler nodes that measure the supply and return temperatures as well as the return air’s relative humidity. Specifically, Panduit employed its SynapSense Wireless Mesh ThermaNode EZ nodes (178 of them), SynapSense Wireless Mesh ThermaNode EZ-H nodes (25), SynapSense Wireless Mesh Pressure Nodes (44), temperature sensors (44), CRAH wireless mesh nodes (13) and SynapSense Wireless Mesh Gateways (3).
The company reports that before the Active Control feature was implemented, CyrusOne’s Austin Data Center II operated 11 CRAH units with an average fan speed of 73 percent, all with return air temperature set points of 70 degrees Fahrenheit. The two fan units that were turned off were not sealed, and cold air from the subfloor was blowing back into the return plenum. After implementing the Active Control feature, all 13 fans were running with an average speed of 62 percent, which brought the power used down from 64.3 kw to 37.9 kw. “This is especially impressive since the 64.3 kw accounted for 11 of the 13 fans working, while the 37.9 kw is representative of Panduit turning on the two fans that were turned off, bringing the fan total to 13,” Panduit points out.
“At the start of the project, the average rack inlet temperature in the data hall was 67 deg. F and the average underfloor pressure was slightly under 0.300 inches of H20,” Panduit continues. It set the target point for the rack inlet temperatures at 78 degrees and the control system increased the return air temperature set point to meet this inlet temperature, because the majority of the rack inlet temperatures were below recommended values. “Today CyrusOne is experiencing a 2- to 7-degree Fahrenheit increased in the return air temperature set points throughout the data hall,” Panduit reports, “with the refrigeration power decreased to 137.4 kw from 149.9 kw. In addition, the floor pressure is perfectly balanced.”
Additionally, the 11 fans that had been on previously all decreased fan speed, even though the average floor pressure in the data hall increased. The hall now has a 2- to 7-degree increase in the return air temperature set points.
Patrick McLaughlin is our chief editor.
EERE summarizes sensor network’s benefits
Based on its experience, including what has been spelled out in this article, the United States Department of Energy’s Office of Energy Efficiency and Renewable Energy (EERE) spelled out the following summary of advantages offered by wireless sensor networks.
- Reduce Operating Expenses - Granular temperature measurements allow optimized operations without compromising server reliability.
- Reduce Capital Expenses - Self-configuring wireless sensors reduce deployment cost; no wires are needed for signals or power.
- Increase Capacity - Extract hidden capacity by truly understanding where cooling is required.
- Reduce Failures - Server inlet temperature measurement provides visibility of cooling system malfunctions.
The information from EERE that is contained in this article came from the website www.energy.gov/eere. A subset of that website focuses specifically on energy efficiency in data centers. The main page for that information can be found at energy.gov/eere/femp/energy-efficiency-data-centers