Every bit counts in a structured cabling system
Paul Kish / NORDX/CDT
As attention focuses on bit--error rate, a close look at its definition and causes is necessary.
One of the newest buzzwords in the cabling industry is "bit-error rate" and, in particular, zero bit-error rate. But what does this phrase actually mean? What is a bit-error rate (BER), and how is it measured? Moreover, what attributes of a structured cabling system affect BER, and how does BER really relate to a system's channel performance?
First, it is necessary to understand the fundamentals of BER. It all begins with the industry that sets industry standards for data networking - the Institute of Electrical and Electronics Engineers (IEEE-New York City). The IEEE has published numerous standards over the past decade, and many would argue that the 10Base-T Ethernet standard is the most influential to our industry. 10Base-T is designed to run over Category 3 twisted-pair cabling, at a minimum, and has rightfully established a solid reputation as a robust, reliable network protocol.
Today, many users are moving from 10Base-T to the 100Base-TX Fast Ethernet protocol, which the IEEE designed to run over Category 5 cabling, at a minimum. However, a perception pervades through the industry that 100Base-T lacks the robustness and reliability of 10Base-T. Furthermore, the general opinion as to why 100Base-TX suffers these limitations is that cabling and equipment-related issues are to blame.
A realistic objective for 100Base-TX is a worst-case BER of no more than one error in every 10 billion bits transmitted (expressed scientifically as 10-10). At a transmission rate of 100 Mbits/sec-100 million bits/sec - this BER equates to no more than one error every 100 seconds. Because the bits travel in groups, called frames, any single error forces the network to retransmit the entire frame in which the error exists. So a BER that significantly exceeds this limit will slow down a network.
Role of noise
Without going into deep scientific and engineering explanation, suffice it to say that the BER is derived from a function called symbol error probability, which has a fundamental relationship with a channel's signal-to-noise ratio (SNR)-the relative difference between the signal level and noise level in decibels. This means that if the SNR is sufficiently large, the probability of a transmission error can reduce, say, for example, to 10-12. However, because there is always noise within a channel or in the environment, there will always be bit errors. The BER may be substantially reduced with higher SNRs, but it will never be completely eliminated. So the claim that a transmission channel achieves zero BER is not scientifically feasible.
Several noise-source types, both internally and externally generated, can contribute to errors in digital-transmission systems. Let's take a closer look at internally generated noise that results from transmission impairment in a channel. 100Base-TX operates over a channel that uses two wire pairs, with one pair used for transmission in each direction. Within this application, the primary internally generated noise sources are near-end crosstalk (NEXT) and noise related to insertion-loss deviation (ILD). ILD may not be a familiar term for many, probably because it is not specified for Category 5 performance. However, ILD can create much more havoc in Category 5 systems than NEXT can.
NEXT and ILD as BER contributors
To calculate the noise component due to NEXT, subtract the total noise power due to NEXT from the total signal power at the receiver. Complex logarithmic equations are necessary to get a true figure, but the simplified subtraction function outlined above is a little easier to grasp. However, for the logarithmic calculation, the total power of the noise and receive signals is determined by integration over a frequency band spanning 1 to 150 MHz. To perform this calculation, it is necessary to obtain the power spectrum of a 100Base-TX signal from measurements taken using a spectrum analyzer.
Using worst-case parameters for a Category 5 channel, the SNR due to NEXT computes to 30 dB over the entire frequency band from 1 to 150 MHz. This 30-dB figure is significantly better than the 16-dB threshold required to achieve a BER of 10-10 for what is called three-level coding. With this information in hand, we can conclude that NEXT for a Category 5 channel is not a major contributor to system error rates for the 100Base-TX application.
It is significant to note that for purposes of comparison, we also calculated the SNR due to NEXT by substituting a Category 3 cable for a Category 5 cable, using the same connectors. In this case, the SNR came out to 10 dB - 6 dB worse than the SNR necessary to achieve 10-10 BER.
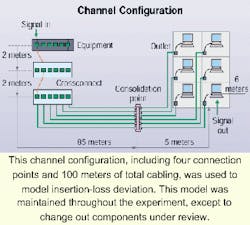
Let's now examine ILD. According to standards definition, a channel is made up of components including cords, connectors, and cables. In a worst-case configuration, a channel can include up to two connectors at each end, an equipment cord, patch cord, horizontal cable, furniture cable that is part of the horizontal, and work-area cord. Each of these components can be characterized as having an impedance and insertion loss, or attenuation.
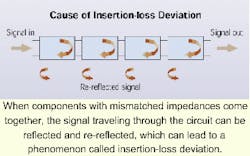
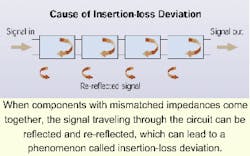
Traditionally, users calculate a channel's total insertion loss by summing the losses of all components. All formulas for a Category 5 and Category 5E channel model in relevant Telecommunications Industry Association Arlington, VA) standards assume that the whole is equal to the sum of the parts. Within this assumption lies a problem: It is only an approximation. And while the traditional method offers a good first approximation of channel insertion loss, the actual figure is in fact higher than what you would calculate simply by summing the losses of each component. The "X" factor here is that reflections and re-reflections at the boundaries between different components cause additional losses.
Impedance is the other electrical characteristic common to each component in a channel. It is the impedance mismatches between components that cause higher losses. Further complicating the issue is that at some frequencies, these signal reflections due to impedance mismatch can add in phase. At other frequencies, they can add out of phase. Therefore, these additional losses are not uniform and will vary depending on patch-cord length, the number of connectors in a channel, channel length, and other physical characteristics of the channel. The difference between actual insertion loss as measured on a channel and the insertion loss determined by adding component losses is called ILD.
Predicting ILD
The expected ILD for Category 5, Category 5E, and Category 6 channels was determined using the channel model described in Annex H of the TIA/EIA-568A-5 standard. That model includes a series of concatenated transmission lines, in which each component is modeled with its own transmission matrix.
The transmission matrix is described in terms of parameters A, B, C, and D. The overall channel transmission matrix is determined using matrix multiplication.
We determined ILD for the following setups:
- 105-ohm Category 5 cable, 90-ohm cord, and a connector with 14-dB return loss at 100 MHz.
- 105-ohm Category 5 cable, 85-ohm cord, and a connector with 14-dB return loss at 100 MHz.
- 105-ohm Category 5E cable, 95-ohm cord, and a connector with 20-dB return loss at 100 MHz.
- 103-ohm Category 6 cable, 97-ohm cord, and a connector with 24-dB return loss at 100 MHz.
- 101-ohm Category 6 cable, 99-ohm cord, and a connector with 24-dB return loss at 100 MHz.
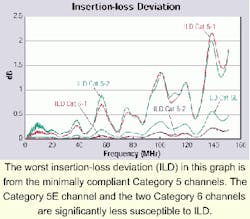
After completing a series of tests to validate the model, we found that the modeling results for a Category 5 channel show a considerable deviation, with ILD peaks of approximately 0.3 dB in the range from 10 to 20 MHz and 1.4 dB at 100 MHz. We deliberately chose a total cord length of 4 meters at one end and a 15- to 20-ohm difference in impedance between the cord and the cable to represent the extreme end of Category 5 tolerance range. We chose these components to simulate a worst-case condition for the 100Base-TX application, where the bulk of signal energy is less than 30 MHz.
Results for a Category 5E channel are significantly better, with an ILD of less than 0.1 dB below 30 MHz and maximum ILD of less than 0.5 dB at 100 MHz. We also reported the Category 6 results for comparative purposes. They do not represent the worst-case but are representative of the type of results that can be achieved using well-matched components.
BER due to ILD
So what, really, is the significance of approximately 0.5 dB of additional loss over the majority of the operating frequency range for a 100Base-TX system? While 0.5 appears to be such a small number, to determine if it is truly significant, we must ask another question: What causes ILD? ILD is caused by another signal superimposed on the receive signal. That superimposed signal appears as noise at the receiver. For the sake of this article, let's use ILX to represent the level of noise, measured in decibels, that when added to the primary signal, produced the observed value of ILD.
For example, if the measured insertion loss is 20.5 dB, and the expected insertion loss - assuming matched components - is 20 dB, then ILX would represent the level of noise that would cause the ILD of 0.5 dB. According to our calculations (the noise and the signal are added as a power sum), it would take an ILX of approximately 30 dB to cause the ILD of 0.5 in this situation.
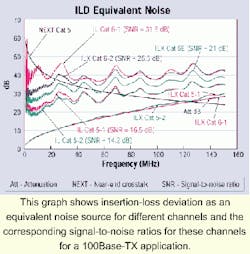
The calculation of SNR due to ILD involves similar logarithmic equations, as does calculating SNR due to NEXT. When we computed the resultant SNR using worst-case parameters for a Category 5 channel, we found that a 20-ohm impedance mismatch between the cord and the cable yielded 14.2-dB SNR due to ILD, and a 15-ohm impedance mismatch yielded 16.5-dB SNR due to ILD. The bottom line is that under certain worst-case conditions, a Category 5 channel is really only borderline-compliant for 100Base-TX applications.
What does this information mean in practice? This worst-case situation is unlikely to occur in practice, except when user cords and cables are at the extreme ends of Category 5 tolerance. But this fact underscores the importance of using components designed to work together as part of an end-to-end system.
The other significant result of this testing is that a Category 5E channel, which is specified with tight tolerances on component return loss - a good measure of impedance mismatch - achieves SNR of 21 dB. This performance provides a 5-dB margin over the SNR objective for 100Base-TX and a 3-dB margin for 1000Base-T. A channel made up of proposed Category 6 components that are well-matched to one another provides even higher margins.
Without question, today's network managers are primarily concerned with their data networks' reliability and performance. Network slowdown or shutdown are costly propositions, and network performance really depends on the cabling's ability to support high data rates. It is important to know whether your installed cabling system has a built-in performance margin necessary to deliver critical information without stumbling.
One way to examine network performance is to measure BER. Information presented here indicates that component impedance mismatch is the most significant contributor to bit errors and can cause some Category 5 channels to exceed the BER objective for 100Base-TX applications. Certified Category 5E channels have an inherent margin of at least 3 dB beyond the minimum required to meet 100Base-TX BER objectives.
Therefore, it is reasonable to conclude that the issue of BER has been satisfactorily addressed with the publication of the Category 5E standard - TIA/EIA-568A-5 - this past January. The standard includes tight requirements for patch-cord impedance stability and cable return loss. Users can be confident that a channel or components certified to meet Category 5E requirements will not contribute to excessive bit errors.
Paul Kish is senior product manager at NORDX/CDT (Pointe-Claire, QC, Canada), responsible for IBDN systems and standards.
Editor's note: This article is based on the white paper "The Effect of Network Cabling on Bit Error Rate Performance" by the same author. That paper includes deeper scientific detail of some of the concepts brought forth in this article. You can read the paper at NORDX/CDT's Website, www.nordx.com. To go directly to the white paper on SNR and BER, visit www.nordx.com/public/htmen/pdf/ZeroBErrorRate.pdf.
Bit-error rate and live network testing
Rob Bezjak, Graybar
Some network tests that claim to be "live" or "dynamic" are not live at all. They are done with simulated traffic, initiated through a device one port at a time. These tests have no relevance to possible noise conditions found once a network is fully active. Many of the performance claims are also being made on 2-connector channels, when the Telecommunications Industry Association (TIA - Arlington, VA) has specified a 4-connection model as the worst-case and stated testing should be based upon a 4-connector model.
Manufacturer claims based on active test data should be examined in detail. When you look at them closely, you likely will discover that the data being used to make the claim of error-free performance is data from testing done on the cabling system. The simulation testing is conducted after the signal-to-noise-ratio data has been gathered.
When establishing guidelines for channel performance for Category 5E, the TIA TR-42.7 subcommittee factored in the requirements of the IEEE 802.3 for the 1000Base-T application. These requirements were developed to ensure the network error-rate objectives were not exceeded for a worst-case condition. The bit-error-rate objective for 1000Base-T is less than one bit error in 10 billion bits of information.
That guideline is the channel specification published by the TIA, with the Category 5E standard. However, some future versions of Gigabit Ethernet and some Asynchronous Transfer Mode protocols transmit above the previously specified Category 5E frequencies. That is why Graybar established its own requirements in the VIP program and independently tests randomly selected products from our inventory.
The claims of no-bit-error performance thanks to a well-performing cabling system are true, in a sense, because no Category 5E-compliant cabling system, when properly installed, can contribute to excessive bit errors. So, if we do measure product performance in the laboratory and have the ability to measure installed performance of the cabling system in the field, network-simulation testing proves to be an exercise without data that can be correlated to real-world performance.
If a customer really wants information on network performance, that customer should use the software that runs with the Ethernet switch. It can provide nonintrusive data collection on all ports, without requiring connection of an external device, at a fraction of the price of simulated traffic testing.
Rob Bezjak is national market manager with Graybar (Clayton, MO).
Rob Bezjak, Graybar