Program tests premises systems at extended frequencies
Manufacturers submit their systems to testing against stringent performance criteria.
Thomas R. Russell and James Rivernider/Quabbin
Wire & Cable Co.
With the TIA/EIA-568A Commercial Building Tele-communications Cabling Standard nearly three years old, the Category 5 requirements specified in that document should be considered minimum standards. Such new protocols as Asynchronous Transfer Mode, 100Base-T Ethernet, and Gigabit Ethernet have network managers concerned about how their networks will perform at the higher frequencies and data rates required by these technologies. Current test methods have to change to measure critical new parameters.
Impedance is among these important parameters. Impedance stability is more difficult to achieve at high frequencies. A cable pair`s impedance varies very slightly along its length due to small variations in manufacturing, such as concentricity, diameter, quality of twisting, and wall thickness. These small impedance variations along each pair create signal losses due to reflections of the energy transmitted along the pair. These losses are more significant at higher frequencies because as the signal wavelengths become shorter, small variations become more "visible" in the network.
Return loss, which is a measure of all the relative reflected power lost in a network, is another critical measurement. System return loss is so important for Gigabit Ethernet performance that it is one of the new test criteria now being defined for existing Category 5, enhanced Category 5 (also known as Category 5E), and Category 6. Return loss is measured from the ideal 100-ohm impedance target for the network. Currently, the TIA/EIA-568A standard requires that manufacturers measure structural return loss for cable, not an entire network. This is a special case of return loss, with measurement based on an averaged or smoothed impedance line.
A network`s return loss becomes more important at higher frequencies and is critical for successful Gigabit Ethernet implementation because that configuration will use full-duplex (i.e., bidirectional) transmission on each pair. Reflected energy will be "seen" as noise at the receiver. Echo cancellation will be used to minimize this noise. Without cancellation, a worst-case Category 5 installation would not support Gigabit Ethernet or other high-speed applications using bidirectional pair transmission.
Quabbin has set up a test program to assess Category 5E cabling systems to discover what the best realizable performance would be for a 4-pair unshielded twisted-pair (UTP) network. We outlined the test program to manufacturers of premises hardware and invited them to participate. They were asked to recommend their best connectors, patching systems, and other hardware to be included in the evaluation. Impedance, return loss, and other data that relate to system performance were to be measured for each manufacturer`s premises system. The goal was to learn how these systems performed and also which systems were most compatible with high-performance horizontal and patch-cord cabling. We assured manufacturers that only they would see their own system`s performance data.
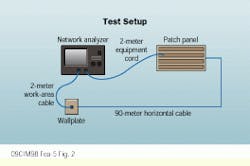
To measure the high-frequency performance of these next-generation networks, a realistic local area network (LAN) premises hardware system was set up. A network analyzer was connected to 2 meters of patch cord that represented work-area cabling. The work-area patch cord was terminated through a wallplate to a 90-meter run of horizontal cable. The horizontal cable was connected to a patching system, which would normally be in the wiring closet. The last portion of the network was another 2 meters of patch cord, which would normally go to a hub, bridge, or router. For the test, the equipment patch cord was terminated back to the network analyzer. We tested both directions through the network, which approximated a long-length basic link as defined in TIA/EIA-568A and telecommunications systems bulletin TSB-67.
The cabling was connected to the network analyzer through a connector, a high-frequency balun, and then into the network analyzer. On the other end of the network, the cable was pinned out to a connector and terminated to a precision 100-ohm load.
We have now evaluated more than two dozen premises hardware systems and various combinations of patch and horizontal cabling, and the list is still growing. First, it was learned that there is a significant difference between hardware systems, especially above 50 megahertz. Also, it was discovered that a 2-meter length of patch cord has a very large effect on the system`s performance, especially on return loss and impedance. Third, all premises systems, regardless of quality, benefit from using the best available patch cord. We were surprised to discover the great importance that the patch cord has on a high-frequency network.
Except for one system that used a proprietary cable, the same 90-meter, high-performance horizontal cable run was used in all tests. The only change to each premises system was to exchange two lengths of patch cord. In one case, we used cords assembled with a minimum-performance Category 5 cable, and in the other case, the patch cord was assembled using high-performance patch cable. In both cases, the cords used the same plugs: two-piece Category 5 plugs from amp Inc. (Harrisburg, PA). Thus, the only variables in this data were the premises hardware itself and the quality of the cable used to assemble the 2 meters of patch cord. The performance of the patch cord was based on bulk cable tests of patch cable. Impedance variation and nominal impedance were used to identify high- and low-performance cable.
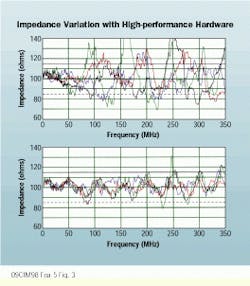
When a high-performance hardware system was tested with the lower-quality patch cord, impedance stability, which ideally should be close to the 100-ohm target line, began to break down at about 50 MHz. Above 50 MHz there were wide variations in the measured impedance. When the same high-performance hardware system was tested with a higher-quality patch cord, impedance became smoother and was relatively flat out through 350 MHz.
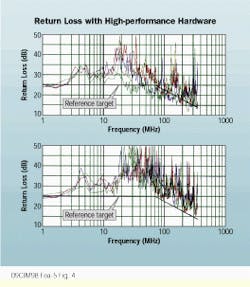
When we measured return loss for this high-performance system using the marginal patch cord, it was good to 20 MHz only. The darker line that is drawn at 25-decibel return loss out to 70 MHz, which then decreases, represents a reference target for comparison purposes only. The return loss for this same system with high-performance patch cords meets the reference target level. We did not expect that 2 meters of patch cord could have such an impact on a network.
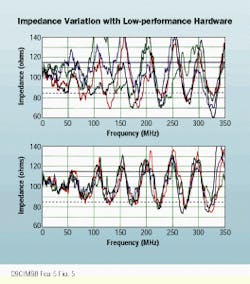
With a lower-performance hardware system, impedance stability began to break down at approximately 30 MHz with a low-performance patch cord. Installing a high-performance patch cord in this low-performance hardware system improved its performance. Cable impedance was relatively smooth out to about 100 MHz.
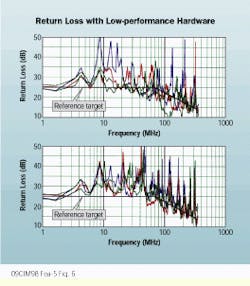
Measuring return loss for the lower-quality system in combination with the lower-performance patch cord illustrates performance to the reference line that extends out to only 10 MHz. Beyond 10 MHz, return loss deteriorated rapidly. However, the return loss for this system was also significantly improved by changing the patch cords.
Propagation delay and delay skew
A recent addendum to the TIA/EIA-568A standard added new test requirements for propagation delay and delay skew. Propagation delay is a measurement of the time it takes for a signal to propagate through a length of cable. Since each pair has a different degree of twist, their electrical lengths vary and the signaling delays are different. Delay skew is a measurement of the signaling delay difference from the fastest pair to the slowest. Again, our tests demonstrated that simply changing the patch cord provides a significant improvement in delay skew.
Next, we took data from one of the best systems (the high-performance hardware with the high-performance patch cord) and plotted system attenuation-to-crosstalk ratio (ACR). ACR is roughly equivalent to the signal-to-noise ratio in a circuit because crosstalk is the most significant source of noise, and attenuation measures signal strength. However, we plotted power-sum ACR instead of ordinary ACR. That is, the acr has been calculated using the more difficult power-sum crosstalk measurement. This network had an impressive measurement of positive acr past 200 MHz. The network also met 10-dB power-sum ACR at 160 MHz--extremely good performance for a network that represents a near-maximum-length configuration. However, it should be noted that almost all premises systems tested exhibited very similar ACR data. Therefore, ACR is not a good measurement to differentiate system performance.
Another look at standards
When using lower-frequency lan protocols such as 10Base-T, some of the criteria we tested for in our program--for example, return loss, far-end crosstalk (fext), and impedance stability--do not apply or can be ignored. For the same reasons, the protocols are not included in the existing tia/eia-568a standard. But, they will be critical to the successful operation of 1000Base-T or other systems using full-duplex encoding methods.
Furthermore, with the additional cabling performance requirements, it may no longer be sufficient to define network performance using a single measurement or ratio at a specific high frequency, such as ACR. In fact, the Gigabit Ethernet committee rejected ACR as a standard criterion because, once near-end crosstalk (NEXT) is improved to a certain point, attenuation becomes more important.
It is more critical to examine the total reflected, coupled, or lost-signal energy over the complete frequency range of operation. Future network performance may be limited by return loss. That`s why the IEEE 802.3 Gigabit Ethernet committee had to know the return-loss performance limits for various category systems before it could specify the active components that are going to drive the signaling. The Telecommunications Industry Association (TIA--Arlington, VA) set up Task Group PN-3727 specifically to define the return loss and other characteristics for the installed base of Category 5 systems, as well as for the newer Category 5E and developing Category 6 systems.
Last March, the draft documents defining return loss and other characteristics for Category 5 and Category 5E were sent out of the Task Group for comments and ballot. At this time, many comments have been received and are being resolved. The new test requirements for Category 5 will soon be issued as a TSB document. The complete definition for Category 5E is more complex, so it will follow later as an addendum to TIA/EIA-568A. The Task Group is testing components, gathering data, and constructing mathematical models to simulate the performance for the newest Category 6 utp systems. Category 6 will represent a major development beyond Category 5 and 5E. Category 6 is intended for networking applications beyond 1000Base-T. Gigabit Ethernet is being designed to be completely backward-compatible and will not require Category 6 premises hardware to operate successfully.
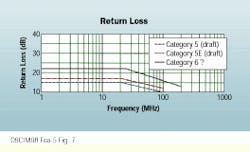
Although all comments on the return-loss performance levels for installed Category 5 and Category 5E networks are not resolved, it is interesting to compare these performance levels as illustrated in the figure below. There is a 2-dB improvement between the minimally compliant Category 5 system and the more current Category 5E premises system.
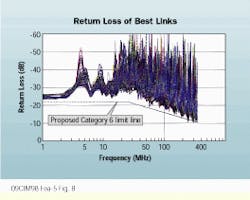
Where will the system return loss for Category 6 likely be set? The following figure shows data drawn from our test program. It shows eight of the best systems, with all four pairs, measured from both the patch-panel and wallplate ends. The data is probably representative of the return-loss performance you can expect from cutting-edge Category 5E systems. We have added a limit line that these best systems meet with some margin. Note that this performance level is considerably better than what is now specified for Category 5E.
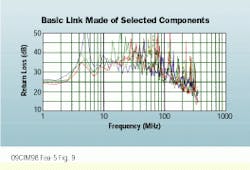
How good can return-loss performance be? By selecting the best matched components we were able to produce the results shown on page 66. This link has about 15 dB of margin over much of the frequency range when compared to the performance of the above best Category 5E systems. This link combines different manufacturers` products and shows that it is possible to build a cabling system with significant improvement over Category 5E.
What does our test program prove? At this time there is no approved specification or test, nor are there pass/fail criteria that define what our test data should be compared to. However, system return-loss performance is being studied and quantified by the TIA`s UTP Systems Task Group and will be specified for Category 6 components and systems.
Our program demonstrates that component variability is an important factor in network performance. We found that some manufacturers have wallplates that perform much better than their patching system and vice versa. Others have extremely good control of their system components from both ends. If the connector and cable do not match closely the 100-ohm system impedance target, they will not perform well as a system.
We also demonstrated that you have to look at end-to-end performance of a system to understand it. It is not sufficient to look at the performance of a component. A marginal component can have a huge negative effect on the entire system at high frequencies.
Our testing also showed that systems with the best performance have the most margin and will survive some abuse during installation. Subtle changes or small mistakes in terminating a connector or connecting the system were immediately apparent. The test program demonstrated that it is possible to assemble premises systems that will support protocols requiring very rigorous high-frequency performance.
Finally, the program clearly demonstrated that a high-performance patch cord is critical to ensure the optimum high-frequency performance of any premises hardware system.
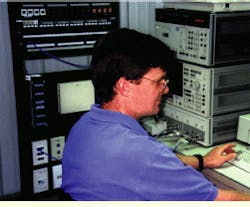
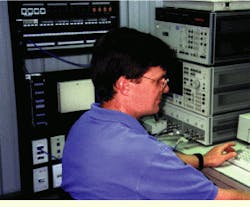
Quabbin`s actual test setup consists of a vertical rack with equipment mounted in it. At the top are the patch-panel devices. Each manufacturer`s patch devices were mounted in a slot. The wallplate hardware can be seen at the bottom of the rack. At right is the network analyzer. The PC driving the system is in front of the operator.
This test setup simulates link performance to 350 MHz.
With high-performance hardware and a low-performance patch cord, impedance variation increases at about 50 MHz (top). The same hardware used with a high-performance patch cable results in much smoother impedance (bottom).
Return loss is good to 20 MHz when high-performance hardware is used with a low-performance patch cord (top). Substituting a better patch cord meets the reference target level--the dark line drawn at 25-dB return loss out to 70 MHz (bottom).
Impedance variation increases at 30 MHz when low-performance hardware and patch cord are used (top). Using a better patch cord results in much smoother impedance to 100 MHz (bottom).
Return loss is good to 10 MHz when low-performance hardware and patch cord are used (top), but is good to 50 MHz when a high-performance patch cord is substituted (bottom).
Draft return-loss limits show approximately 2-dB improvement between the minimally compliant Category 5 system and the more current Category 5E premises system.
Return loss is shown for eight systems, measured from both ends and covering all four pairs.
Return loss for a mixed-vendor system has about 15 dB of margin over much of the frequency range when compared to those best systems.
Thomas R. Russell is vice president of marketing and sales and James Rivernider is product engineer, both at Quabbin Wire & Cable Co. (Ware, MA). This article is adapted from a presentation made at the 1998 BICSI Summer Conference in Toronto. To obtain specific performance evaluation test data from particular premises system manufacturers, contact those companies directly.
